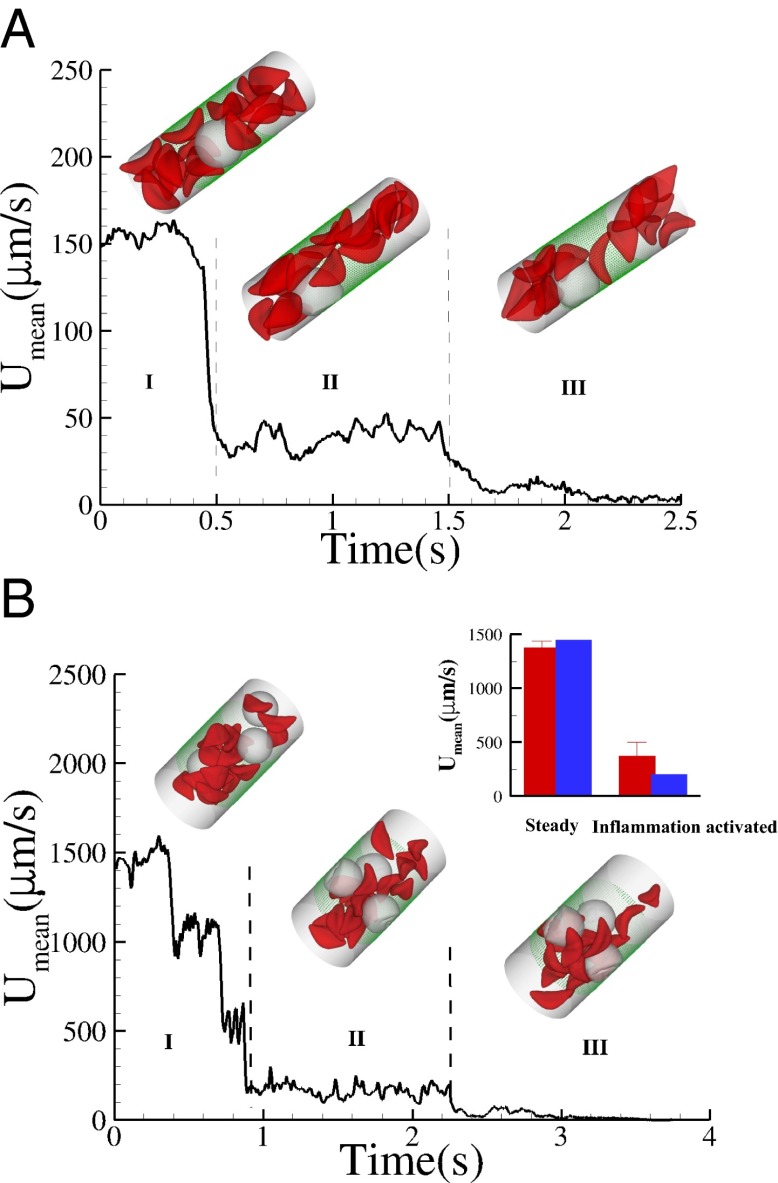
Fig. 4.
Effect of leukocytes: instantaneous mean velocity of the blood flow in a tube of  , one leukocyte (A) and
  ,
,  , three leukocytes (B). (Inset) Snapshots represent blood cells in free motion, leukocyte adhesion, and blood occlusion states. For
  , the Inset plot represents the blood flow velocity of the present study (blue) and the experimental results (red) (12), where measurements are taken on
  venules with average diameter
  and
and  before and after inflammation–stimulation; Movies S5, S6, S7, S8, S9, and S10.

