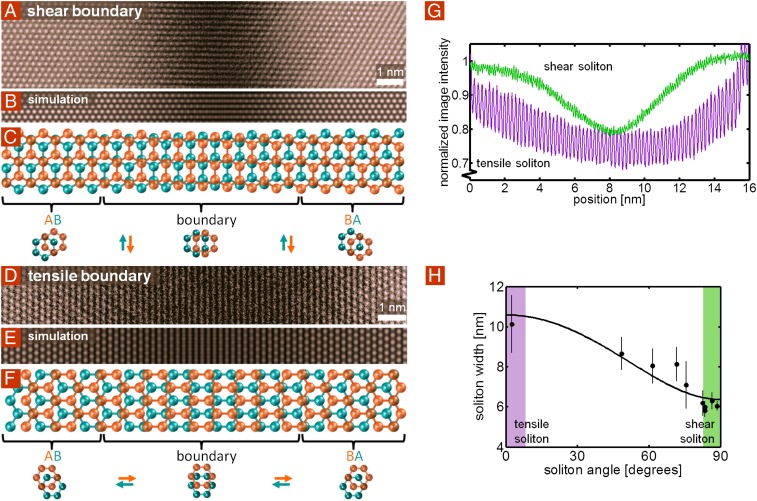
Fig. 3.
Imaging solitons with atomic resolution. (A and D) Atomic-resolution STEM images of AB–BA domain boundaries, exhibiting interlayer shear strain and tensile strain, respectively. As one moves across the boundary from left to right, the two sheets translate relative to each other in opposite directions, as indicated by the schematics in C and F. Each image is an average of four adjacent regions along a boundary (details in Supporting Information; raw images in Fig. S4). (B and E) Simulated STEM images of shear and tensile boundaries, respectively, show good agreement with the experimental images in A and D. The atomic coordinates have been specified by the soliton solution to the sine-Gordon equation (1), discussed in Supporting Information. (C and F) Schematics showing shear and tensile boundaries, respectively (not to scale). In C, from left to right, the orange lattice translates downward, whereas the teal lattice translates upward, completing a one-bond-length armchair-direction interlayer translation from AB to BA. Similarly, in F, the orange lattice translates to the right, whereas the teal lattice translates to the left. (G) Vertical line averages of the images in A (green) and D (purple) reveal that the STEM contrast profile across the boundary is approximately Gaussian, and that the shear boundary is significantly thinner than the tensile boundary. A dark reference signal has been subtracted, and the image normalized by the average intensity of Bernal-stacked bilayer graphene. (H) FWHM for the STEM intensity profile for a few different solitons as a function of the absolute value of the angle between the interlayer-translation direction and the soliton boundary-normal. The fit is given by the equation in the text and indicates that the angular dependence of soliton width is explained by the decrease in stiffness associated with a change from tensile strain to shear strain.

