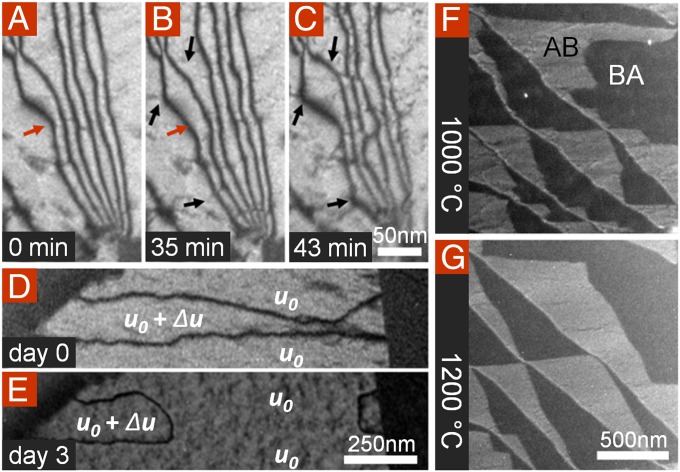
Fig. 4.
Soliton motion. (A–C) [−2110] DF-TEM images of interlayer solitons taken over the course 43 min while imaging at high beam intensity (Movie S1). Under the influence of the beam, the soliton positions fluctuate by as much as 20 nm, as indicated by the arrows. (D and E) A pair of solitons having opposite translation directions (i.e., boundaries on either side of a region that is one-bond-length-shifted from the surrounding bilayer) may annihilate each other, as seems to have happened in the 3 d between which these images were taken. In the center, where, in D, the solitons are in close proximity, they have joined and disappeared in E. (F and G) First and last frames of DF-TEM taken through a [−1010] diffraction angle at 1,000 °C and later at 1,200 °C, respectively. The boundaries between Bernal-stacking domains get shorter and straighter with time and temperature. For movies, see Movies S2, S3, S4, and S5.

