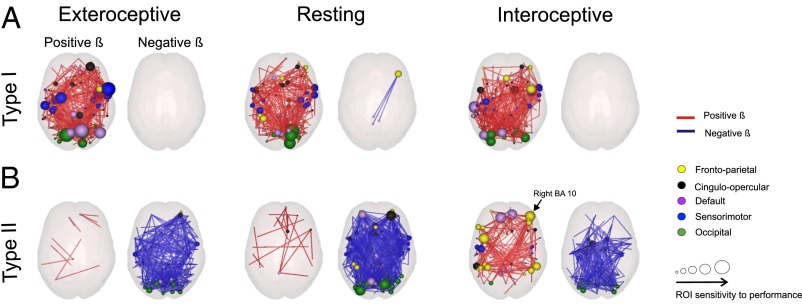
Fig. 2.
Dependence of functional brain connectivity with type-I and type-II performance measured by a bivariate regression of connectivity to both factors. Red links denote positive beta (β) values (connectivity increases with performance). Blue links negative β-values (connectivity decreases with performance). For visualization purposes only β whose absolute value exceeded 3 SDs were depicted. For each ROI, the size of the sphere denotes the number of connections exceeding 3 SDs. Color indicates the functional system to which the ROI belongs. (A) β-Values for type-I performance. ROIs whose connectivity varies positively with type-I performance were mostly located in medial and posterior brain regions. The four ROIs with the highest rank in the number of connections exceeding a threshold (for networks measured under exteroceptive state, the state with the highest average β-value) are in dorsal frontal cortex ([60, 8, 34]), occipital cortex ([−16, −76, 33]), the precuneus ([11, −68, 42]) and parietal cortex ([−26, −8, 54]) (see Table 1 for the top 15 ROIs), which is consistent with previous findings of connectivity in the resting state predicting visual performance (11). (B) β-Values for type-II performance. The spatial distribution of ROIs whose connectivity increases for increasing type-II performance was mostly located in frontal regions in the FP and DBN. The 4 ROIs with the highest rank in the number of connections exceeding a threshold (for networks measured under interoceptive state, the state with the highest average β-value) are in the ventromedial prefrontal cortex ([−11, 45, 17] and [9, 51, 16]), the dorsal frontal cortex [−42, 7, 36] and the anterior prefrontal cortex [42, 48, −3] (see Table 2 for the top 15 ROIs).

