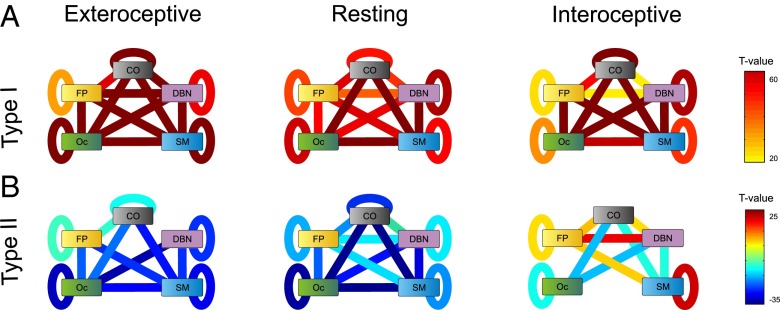
Fig. 3.
Connectivity between functional systems and its relation with type-I and type-II performance. (A) T values from a one-sample t test analysis quantifying the magnitude of β-values for type-I performance averaged across system pairs, for all attentional states. Negative t values indicate a decrease in connectivity between systems n and m as type-I performance increases, whereas a significantly positive value indicates a connectivity increase between systems n and m increases as type-I performance increases (P value of 10−5, Bonferroni corrected for multiple comparisons). (B) T values from a one-sample t test analysis quantifying the magnitude of β-values for type-II performance averaged across system pairs, for all attentional states.

