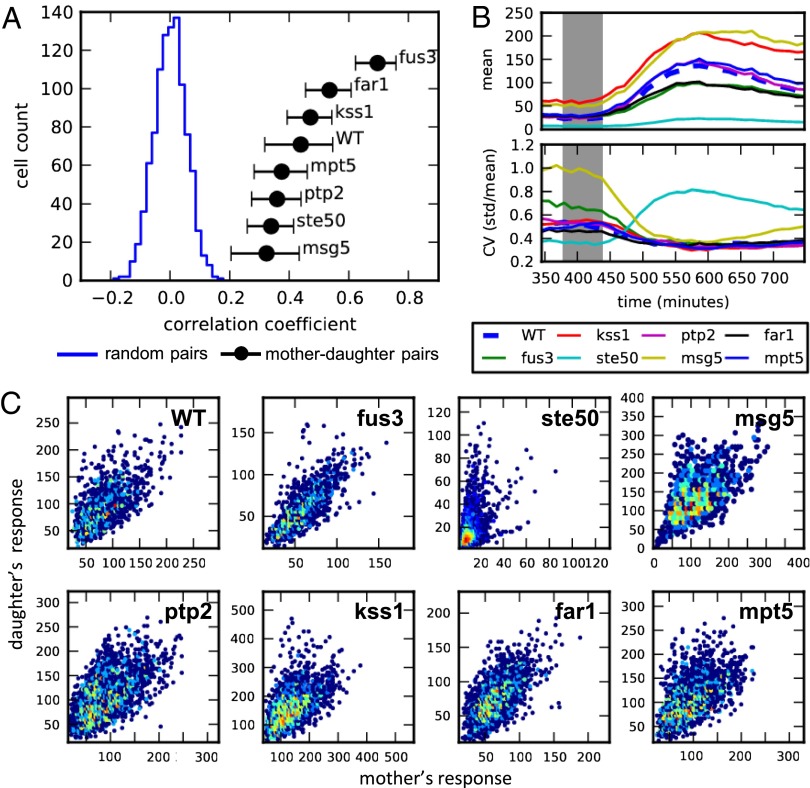
Fig. 2.
Nongenetic inheritance and variability in pheromone response of eight deletion strains. (A) Plot showing the distribution of correlation coefficients for WT random pairs (blue) and the mean correlation coefficients of mother–daughter pairs of all tested strains (black). Cells were first grown over 6 h in media to allow for several divisions and then exposed to 1 h of 100-nM α-factor. Average mCherry fluorescence of each cell was measured 3 h after the beginning of the pheromone induction and used to calculate the correlation of mother–daughter pairs and random pairs born prior induction. Error bars represent SEs. (B) Mean response (Top) and coefficient of variation (Bottom) of each strain over time. Gray area shows period of pheromone stimulation. (C) Heatmaps of the mother–daughter correlations composed of data measured at five consecutive time points between 2 and 3 h after stimulation.

