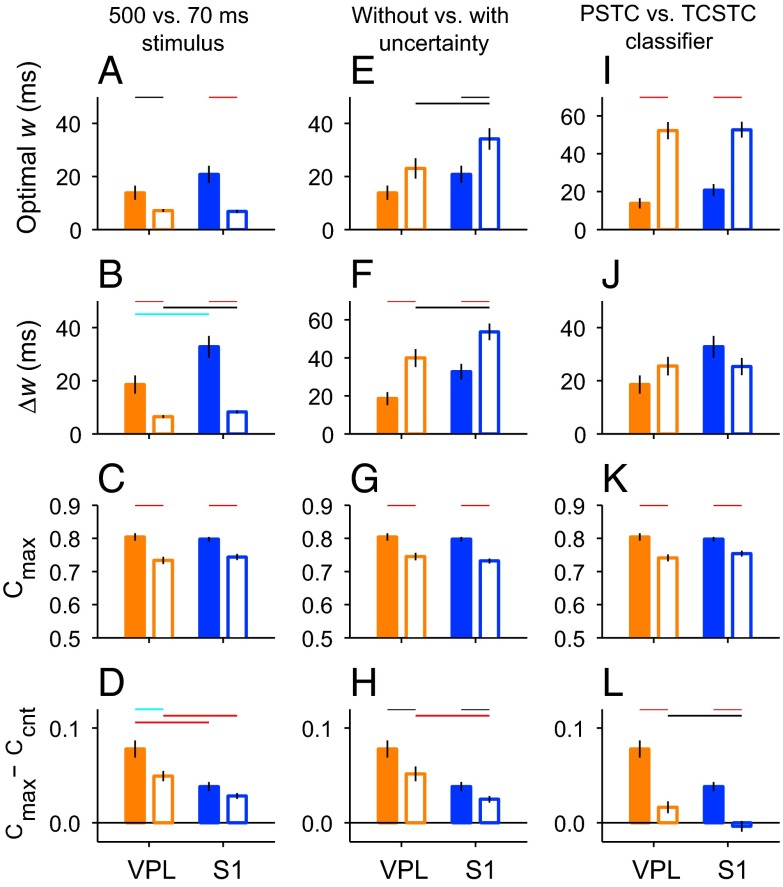
Fig. 5.
Detection performance in VPL and S1 under alternative conditions. In all panels, bars and vertical lines indicate mean ± SEM, respectively, of the quantities indicated on the y axes, i.e., optimal width, range of optimal widths (∆w), maximum fraction of correct classifications (Cmax), and the difference between Cmax and Ccnt. Horizontal colored lines indicate significance levels for each comparison (black: P < 0.05, cyan: P < 0.01, red: P < 0.001). Orange and blue bars are for VPL and S1 data, respectively. Filled bars correspond to the standard condition, in which spike trains elicited during the full stimulation period (500 ms) were analyzed by the PSTC and the stimulus onset was known to the classifier (no temporal uncertainty). (A–D) Results in the standard condition and when only the spikes in the first 70 ms of stimulation were used by the PSTC (open bars). (E–H) Results in the standard condition and when the stimulus onset time was unknown to the PSTC (temporal uncertainty, open bars). (I–L) Results in the standard condition and when performance was assessed by a suboptimal classifier, the TCSTC (open bars). To avoid clutter, significant differences between VPL and S1 neurons in the standard condition (filled bars) are indicated only in A–D.

