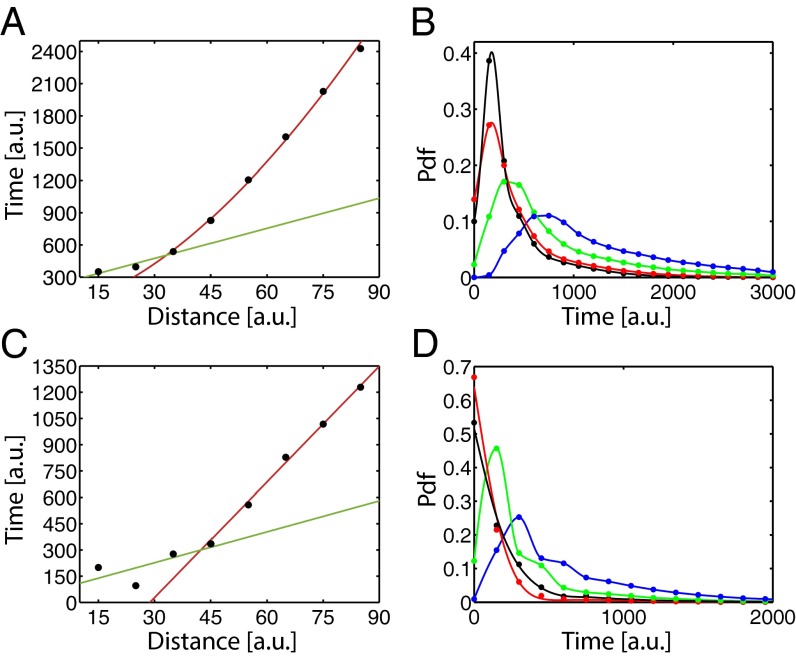
Fig. 1.
(A and C) Evolution of the average search time with initial distance from the source. (B and D) Evolution of the statistics of searching time with initial distances. In A and B, simulations were performed with the windless scheme, with λ = 30 a.u, V = 0 a.u., γ = 0.8, NM = 750, and T = 1. V is the velocity of the wind. In C and D, simulations were performed with the wind scheme, with λ = 30 a.u, V = 0.5 a.u., γ = 0.25, NM = 750, and T = 1, and with the initial position of the searcher uniformly drawn within a 30° angle from a line starting at the source and extending in the direction of the wind. In A and C, the color lines are approximating fits. The green lines are linear fits for short distances; the red lines are a  fit for A and a linear fit for C. Points are the results of simulations (20,000 simulations per point). In B and D, the colors are associated with initial distances: black,
  ; red, d = λ; green,
  ; and blue, d = 2λ. Note the difference in scale between A and C.

