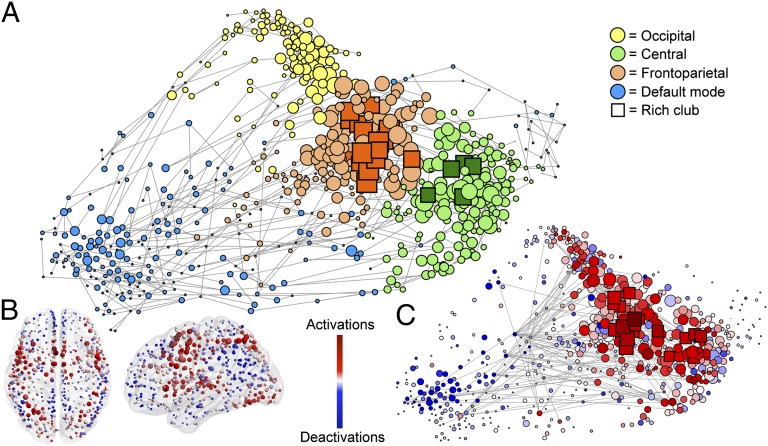
Fig. 3.
Topological representation of the functional coactivation network. (A) Force-based layout of the minimum spanning tree is used to locate nodes in relation to their topological (rather than anatomical) proximity to each other. Different modules are coded by color, and rich-club nodes are represented by squares, with the size of all nodes proportional to their weighted degree (strength). (B) Nodes in anatomical space, colored according to proportion of times they present activations and deactivations. (C) Nodes arranged in the same layout as A, and colored as in B (see Movie S1 for a dynamic perspective on this). Note that the rich club concentrates most of the activations, whereas the periphery and particularly the default-mode network concentrates the deactivations. Edges represent the top 1 percentile of most consistently reported activation and deactivations (no directions shown for clarity purposes). Edges can be seen spanning across different modules.

