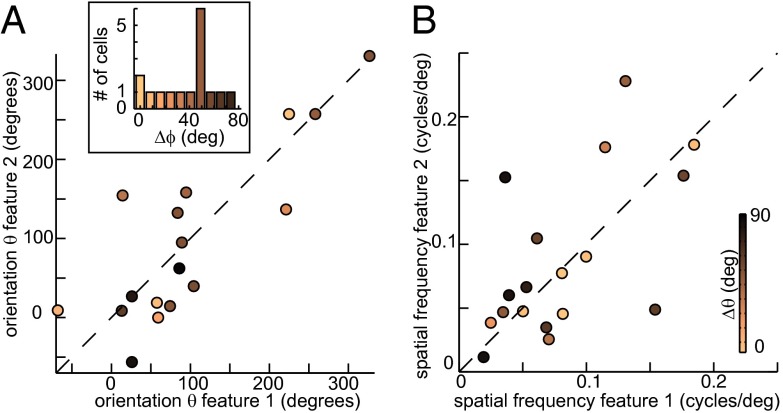
Fig. 3.
The two relevant features often form “quadrature” pairs. Across the population, the two relevant stimulus features have on average the same preferred orientation (A) and spatial frequency values (B). The corresponding P values are 0.44 and 0.59 for linear correlation. Points represent different neurons and are colored by the difference between MIID1 and MIID2 of the same neuron in terms of spatial phase (A) and preferred orientation (B). (Inset) Histogram of phase differences between MIID1 and MIID2 shows a peak at ∼50°, reminiscent of selectivity to a quadrature pair of relevant stimulus features typical of V1 complex cells.

