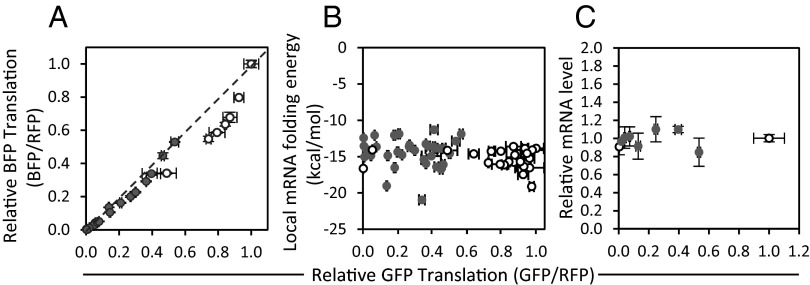
Fig. 3.
Effect of ORF sequence, mRNA folding energy, and mRNA abundance. Normalized GFP expression plotted against (A) expression of BFP, which has a sequence unrelated to GFP; (B) the local ensemble mRNA folding energy; and (C) mRNA level. GFP expression tuned by varying TIS sequences with uORFs (●) or without uORFs (○). Fluorescent protein expression is reported as fluorescence intensity normalized to RFP fluorescence intensity. Error bars represent SD from three experimental replicates.

