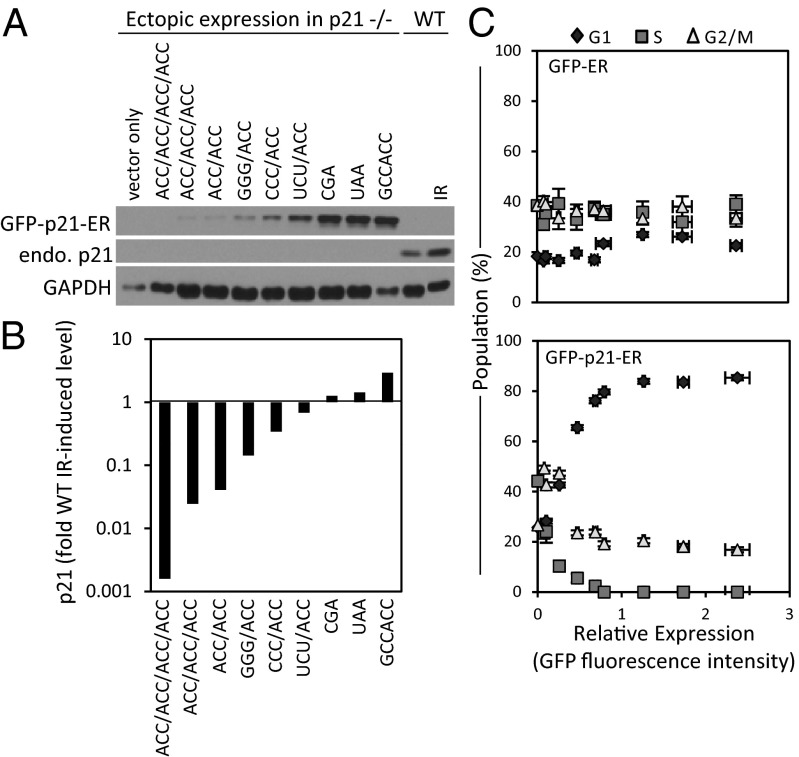
Fig. 5.
Effect of p21 dosage on cell-cycle distribution. (A) Immunoblot of HCT-116 p21−/− cells expressing GFP-p21-ER through use of different translation initiation leader sequences. Endogenous p21 from WT cells with and without IR. (B) Ectopic expression levels in p21−/− normalized to GAPDH measured by densitometry of immunoblot. Sequence notation is same as that of Fig. 2. (C) Cell-cycle population distribution vs. ectopic expression levels for GFP-ER (Upper) and GFP-p21-ER (Lower) in p21−/− cells. ER, estrogen-receptor domain, which allowed induction of activity upon addition of 4-OHT. Error bars represent SD from three experimental replicates.

