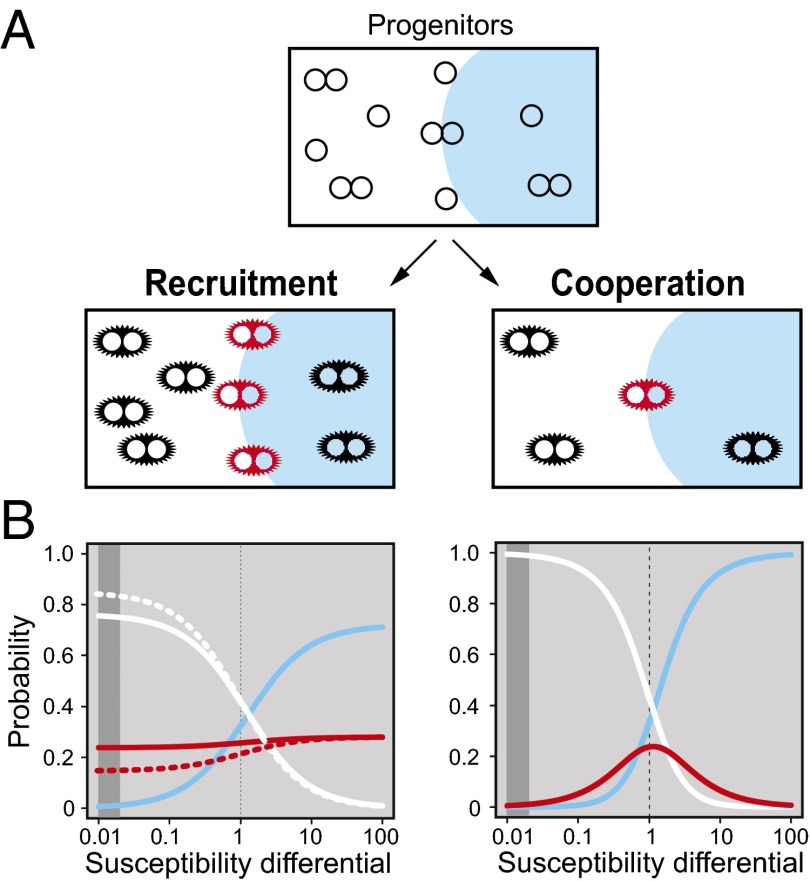
Fig. 1.
Different models could explain interactions leading to the formation of polyclonal tumors. Aggregation chimeras were generated by fusing an embryo that is relatively susceptible to the formation of intestinal tumors (white) to an embryo that is relatively resistant (blue). (A) The number of polyclonal tumors that are heterotypic with a mixture of white and blue (red star) will be high if the more susceptible white progenitors are able to recruit the more resistant neighboring blue cells (Left), but the number will be low if one of the white progenitor needs to be juxtaposed to a rare blue progenitor (Right). (B) Statistical modeling validated this conceptualization. The percentage of tumors that were predicted to be homotypic white (white lines), homotypic blue (blue lines), or a mixture of white and blue (red lines) was plotted vs. the initiation differential, which is the ratio of tumor susceptibilities, using average image statistics for all measured chimeric patterns and using different tumor formation models (each optimized in its parameters): full recruitment with interactions of 67 μm (Left, solid lines); partial recruitment with interactions over 144 μm (Left, dashed lines); and cooperation with interactions over 5,004 μm (Right). The models make distinguishable predictions when the initiation differential is far from one (e.g., 0.15 or less). The dark gray band ranges from 0.01 to 0.02, which is the probable initiation differential between Apc1638N/+ and ApcMin/+. In contrast, when the ratio is 1 [i.e., both embryos are equally susceptible to the formation of intestinal tumors as in previous studies (3, 4, 7)], the two models are indistinguishable.

