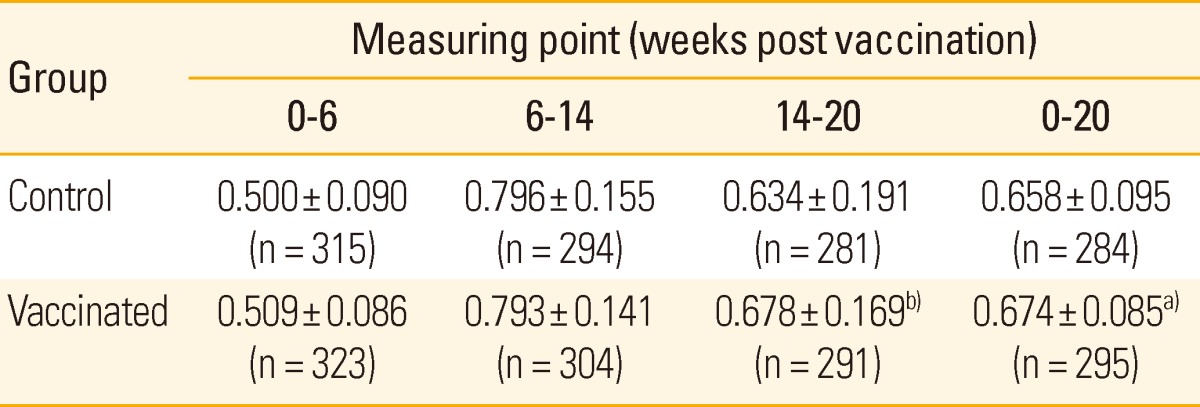
Table 3.
Average daily weight gain after vaccination

Values are presented as mean±standard deviation (kg).
n, number of pigs.
a)p < 0.05, b)p < 0.01 for the differences between two groups.
Average daily weight gain after vaccination

Values are presented as mean±standard deviation (kg).
n, number of pigs.
a)p < 0.05, b)p < 0.01 for the differences between two groups.