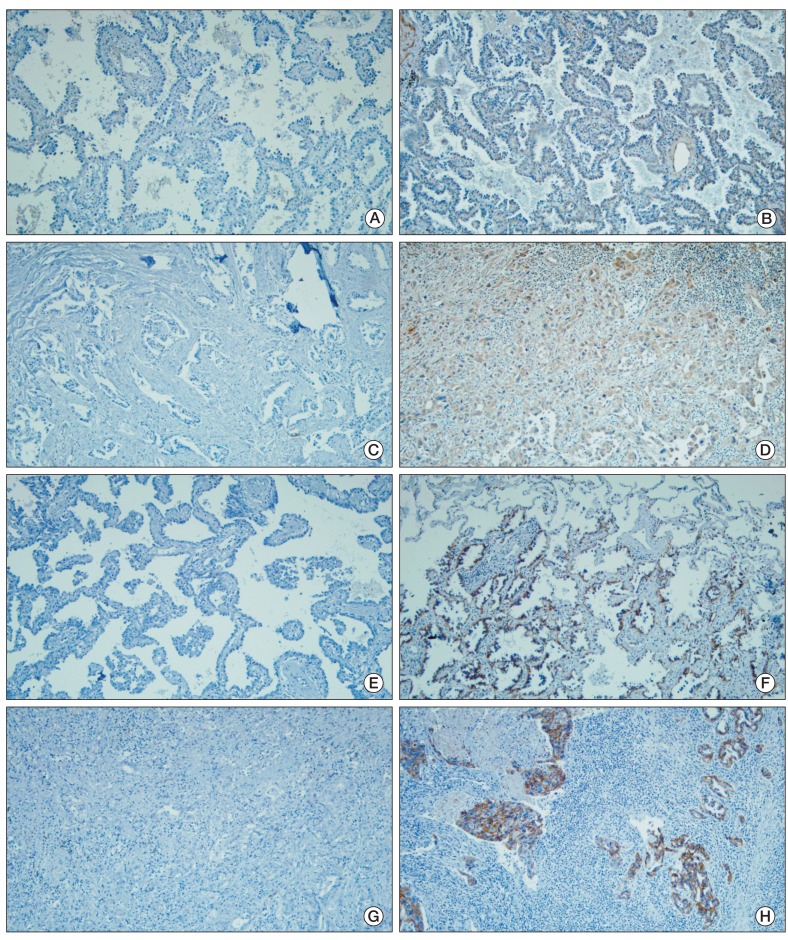
Fig. 1.
Representative immunostaining results for transforming growth factor β1 (TGFβ1) (A-D) and E-cadherin (E-H). Noninvasive component that showed negative (A) and positive (B) staining for TGFβ1. Invasive component that was negative (C) and up-regulated (D) for TGFβ1. Noninvasive element that showed lack of E-cadherin expression (E) and membranous staining (F). Invasive element that was negative (G) and positive (H) for E-cadherin expression (A-H, ABC method, ×100).

