
Table 5.
Expression of TGFβ1 and E-cadherin proteins in each component by subgroup
Values are presented as number (%). TGFβ1, transforming growth factor β1; NA, not available.
Official websites use .gov
A
.gov website belongs to an official
government organization in the United States.
Secure .gov websites use HTTPS
A lock (
) or https:// means you've safely
connected to the .gov website. Share sensitive
information only on official, secure websites.
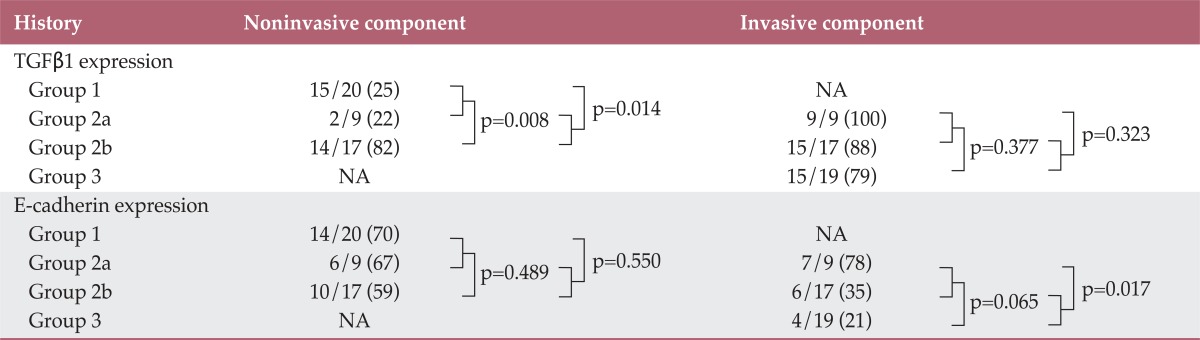
Expression of TGFβ1 and E-cadherin proteins in each component by subgroup
Values are presented as number (%). TGFβ1, transforming growth factor β1; NA, not available.