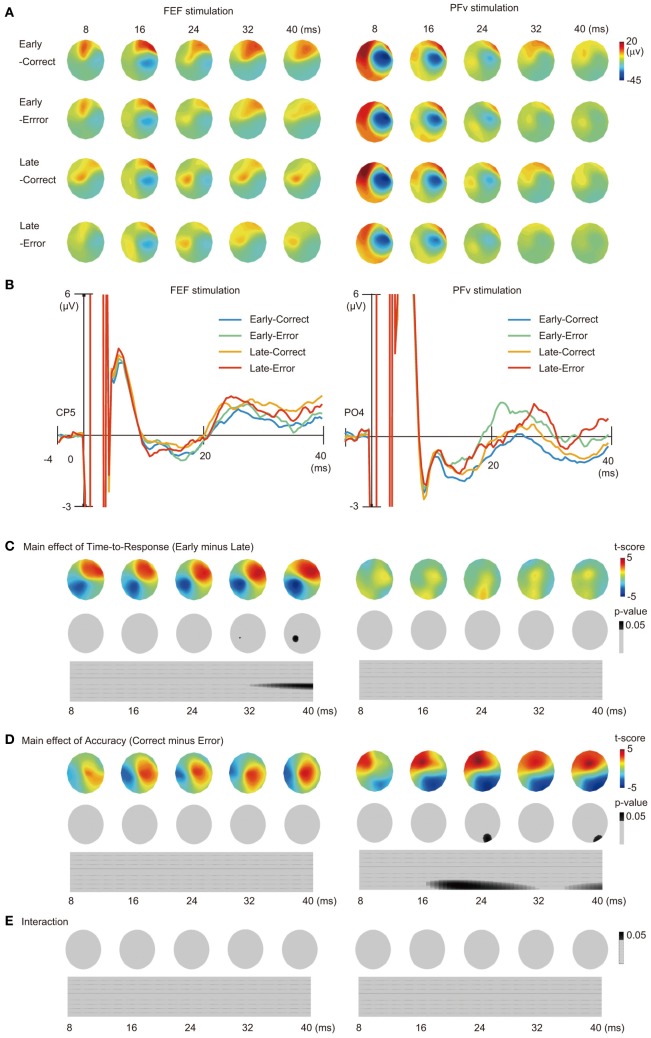
Figure 2.
TMS-EEG experiment. (A) Scalp patterns of TMS-EPs shown in time bins of 8 ms after TMS. Data in which TMS was given early or late during the decision process and data in which subjects made correct or erroneous response are shown separately. FEF (left) and PFv stimulation (right). (B) Waveform of TMS-EPs from CP5 electrode in FEF stimulation (left) and that from PO4 electrode in PFv stimulation (right). Time bins in which there was a significant main effect of Time-to-Response factor (Early vs. Late) and those in which there was a significant main effect of Accuracy factor (Correct vs. Error) are indicated at the bottom of the trace by red tics. (C) Main effect of Time to Response (contrast: Early vs. Late) on TMS-evoked potentials. Scalp distribution of t-scores (upper row) and p-values (middle row, threshold: p = 0.05, corrected for family-wise error). Bottom row indicates 2-D plot of the continuous time series of p-values (abscissa: time from TMS; ordinate: electrode position with left anterior to right posterior electrode shown from top to bottom). Spatial and temporal windows with significant effects are indicated in black. (D) Main effect of Accuracy (contrast: Correct vs. Error). Same format as in (C). (E) Interaction between Accuracy and Time-to-Response. Only the p-value maps are shown.

