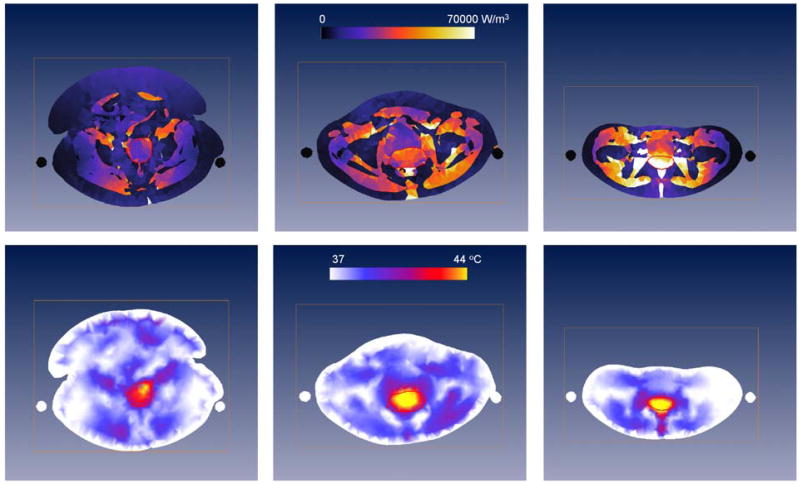
Figure 3.
Cross-sections of the PD for 400W (upper row) and temperature distributions (lower row) predicted by Sigma-HyperPlan for a large (left), average (middle) and slim (right) patient with a cervical tumor (red contour). Visible are also the slings on which the patient is positioned during deep HT (black or white circles on each side of the patient). The temperature distributions are obtained by increasing power until 44°C in healthy tissue is reached.

