
FIG. 9.
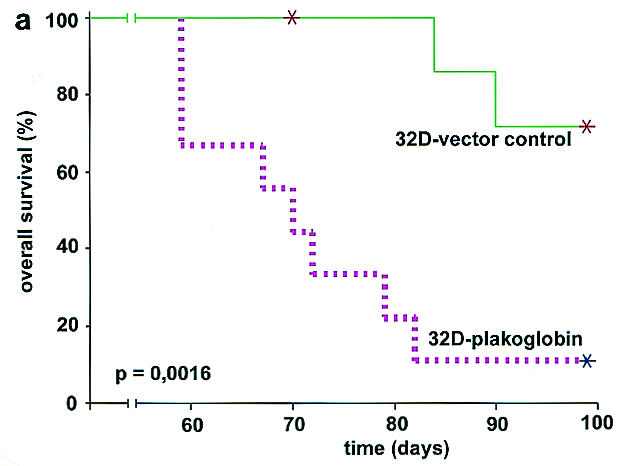


Plakoglobin accelerates leukemogenic growth in syngeneic mice. (a) A total of 2 × 10⁵ 32D cells transfected with either a plakoglobin expression vector or a control vector were injected into syngeneic mice. The mice were monitored over time, and moribund mice were sacrificed. The observed differences in the Kaplan-Meier plot are statistically highly significant (P = 0.0016). The censored control mouse (day 70) was sacrificed for comparison of the organs with those of a moribund plakoglobin mouse. (b) Plakoglobin expression levels were analyzed in the organs of two mice injected with either 32D-plakoglobin or 32D-control cells. The relative expression levels and standard deviation of two quantitative real-time RT-PCR analyses are shown. (c) These photos depict the histological findings in 32D-plakoglobin-transfected mice. The upper two pictures present liver histology, and the lower ones show bone marrow sections.