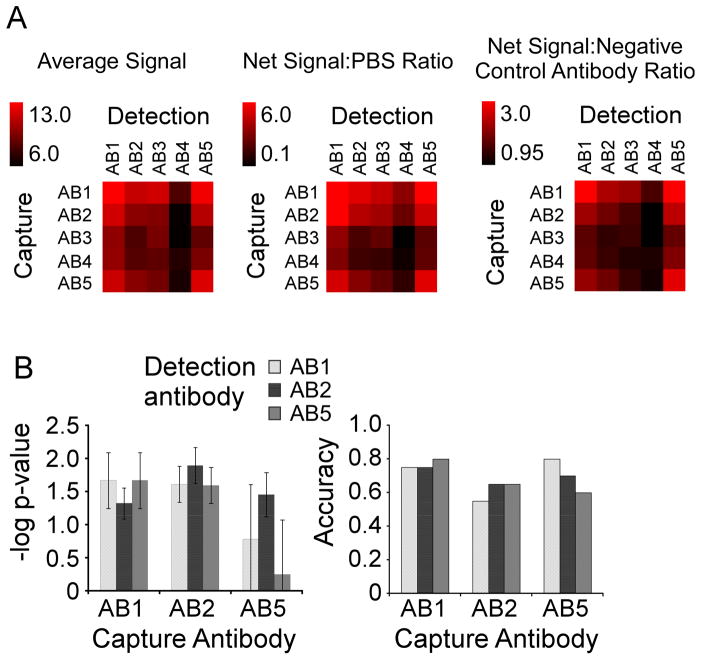
Figure 2.
Performance comparison of the capture-detection combinations. A) Signal comparisons. Each combination of capture and detection antibody was compared by net signal and net signal relative to the negative control array or the negative control antibodies. Net signal refers to the background-subtracted intensity, and the value indicated by each square is the average net signal over all 14 samples. The scale is given by the color bar. To calculate the ratio relative to the negative control array (Net Signal:PBS Ratio), the average net signal was divided by the signal measured in an equivalent array incubated with PBS instead of plasma. To calculate the ratio relative to the negative control antibodies (Net Signal: Negative Control Antibody Ratio), the net signal was divided by the average net signal measured at the negative control antibody (a non-specific monoclonal antibody) for a given detection antibody. B) Biomarker performance comparisons. For each of the nine capture-detection combinations of AB1, AB2, and AB5, the –logged p value (left) and the accuracy (right) for discriminating the 11 cancer patient samples from the 11 pancreatitis patient samples is given. The p value (by students t test) was logged (base 10) and multiplied by −1 for ease of comparison. The dashed line at 1.3 indicates a p value of 0.05. The accuracy was calculated by the number of samples correctly classified (at a threshold giving two false positive elevations of pancreatitis patient samples) divided by the total number of samples. The error bars indicate the standard deviation over three independent measurements.

