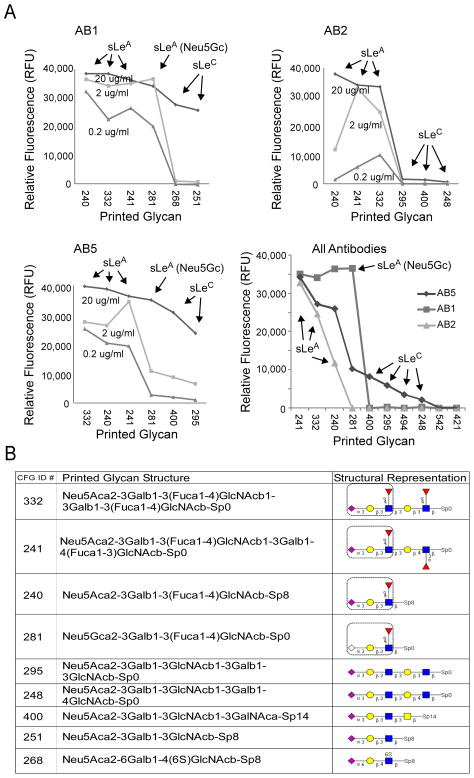
Figure 4.
Glycan array analysis of antibody specificity. A) Antibody binding to particular glycans. Each graph represents the amount of binding of each antibody to specific glycan spots on a glycan array. The top six glycans are shown for each antibody (the structures of the glycans are given in panel B) The lower right graph compares all three antibodies at the 2 μg/mL concentration. Each antibody was incubated on the glycan arrays at three different concentrations. B) Structures of the top-bound glycans. The linear sequence of each glycan is given along with symbol representation, and a box is placed around the sialyl-Lewis A structure (the canonical CA 19-9 antigen). Diamonds indicate sialic acid (abbreviated Neu5Ac or Neu5Gc), circles indicate galactose (abbreviated Gal), squares indicate N-acetylglucosamine (abbreviated GlcNAc), and diamonds indicate fucose (abbreviated Fuc). CFG, Consortium for Functional Glycomics.

