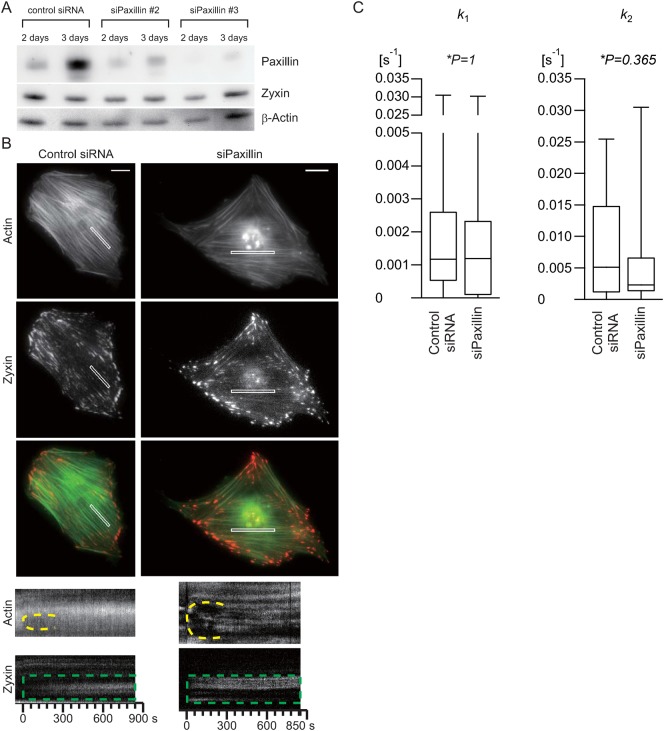
Fig. 4. Zyxin accumulation at damaged SFs in paxillin knockdown cells.
(A) Immunoblot analysis shows paxillin knockdown in the rat fibroblast cell line 2 and 3 days after transfection of rat paxillin siRNAs. (B) The micrographs and kymographs are of AcGFP1-actin and zyxin-TagRFP in rat fibroblasts three days after co-transfection of siRNAs for paxillin knockdown or control siRNA. The kymographs (bottom) were obtained from the white boxes in the micrographs and clearly show transient zyxin accumulation after the application of mechanical damage to SFs (dashed green boxes). The dashed yellow lines in the kymographs show the strained SFs undergoing thinning, elongation, and then repair. Scale bars: 20 µm. (C) Distributions of the kinetic parameters for zyxin accumulation and dissociation during repair of damaged stress fibres in paxillin knockdown cells as box plots created as described in Fig. 2. All parameters were estimated from the kymographs (control siRNA: 9 cells, 12 SFs; siPaxillin: 13 cells, 21 SFs).

