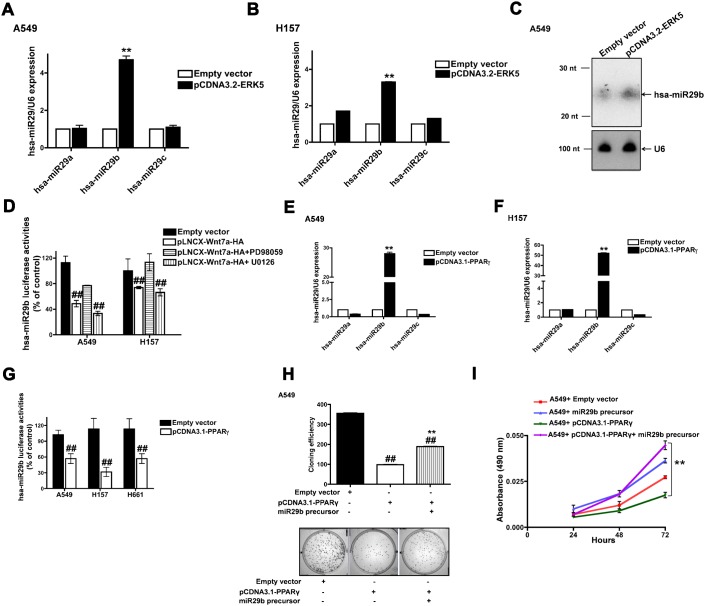
Fig. 3. ERK5 and PPARγ stimulate hsa-miR29b expression in NSCLC cells.
A549 (A) or H157 (B) cells were transfected either with empty vector or ERK5 expression plasmids. After 24 h, total RNA was extracted, reverse transcribed, and real-time PCR analysis was carried out using hsa-miR29a, hsa-miR29b or hsa-miR29c specific primers as described in Materials and Methods. RNU6B was used as the internal control for normalization. Data represent mean ± SEM of three separate experiments performed in duplicates. **P<0.01; versus empty vector control. (C) Northern blot analysis of ERK5-induced expression of hsa-miR29b in A549 cells. A549 cells were transfected either with empty vector or ERK5 expression plasmids. After 24 h, total RNA extracted and low molecular weight RNA was enriched as described in Materials and Methods. 5 µg of low molecular weight RNA was separated on UREA-PAGE gel, and Northern analysis was performed as described in Materials and Methods. (D) A549 or H157 cells were transfected with Wnt7a expression vector together with hsa-miR29b luciferase reporter plasmid, followed by a treatment either without or with MEK inhibitors PD98059 (20 µM) or U0126, (10 µM). After 24 h, the lysates were assayed for luciferase activities as described in Materials and Methods. Data represent mean ± SEM of three separate experiments. ##P<0.01; versus empty vector control. A549 (E) or H157 (F) cells were transfected either with empty vector or PPARγ expression plasmids. After 24 h, total RNA was extracted, reverse transcribed, and real-time PCR analysis was carried out using hsa-miR29a, hsa-miR29b or hsa-miR29c specific primers as described in Materials and Methods. RNU6B was used as the internal control for normalization. Data represent mean ± SEM of three separate experiments performed in duplicates. **P<0.01; versus empty vector control. (G) A549 or H157 cells were transfected either with empty vector or PPARγ plasmids along with hsa-miR29b luciferase reporter. After 24 h, the lysates were assayed for luciferase activities as described in Materials and Methods. Data represent mean ± SEM obtained from three independent experiments. ##P<0.01; versus empty vector control. (H) A549 cells were transfected with PPARγ expression plasmids either alone or together with miR29b precursors. After 24 h, the cells were seeded for clonogenic assays as described in Materials and Methods. Upper panel represents mean ± SEM of number of colonies counted from two independent experiments, while the lower panel displays representative images. **P<0.01; versus A549+PPARγ, ##P<0.01; versus empty vector control. (I) A549 cells were transfected with PPARγ expression plasmids either alone or together with miR29b precursors. Cell proliferation rates were later determined using an MTS assay as described in Materials and Methods. Data represent mean ± SEM from three independent highly reproducible experiments. **P<0.01; versus A549+PPARγ.

