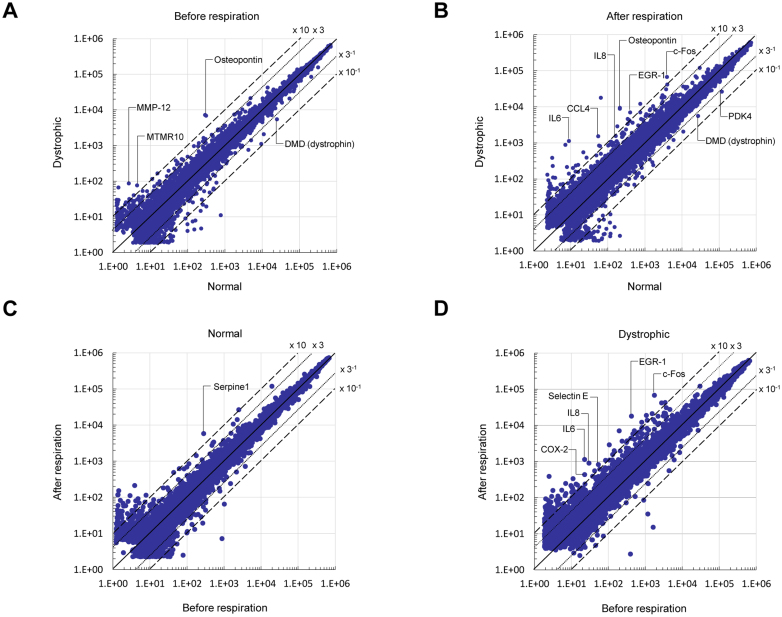
Figure 2. Differential expressed genes in dystrophic diaphragm before and after initial respiration.
(A) A scatter plot of differentially expressed genes on microarrays before respiration in normal and dystrophic diaphragms (n = 4, each). (B) A scatter plot of differentially expressed genes in normal and dystrophic diaphragms (n = 4, each) after initial respiration. (C) A scatter plot of differentially expressed genes in the normal diaphragm before and after respiration (n = 4, each) in the normal diaphragm. (D) A scatter plot of differentially expressed genes before and after respiration (n = 4, each) in the dystrophic diaphragm (cutoff: 3.0-fold).

