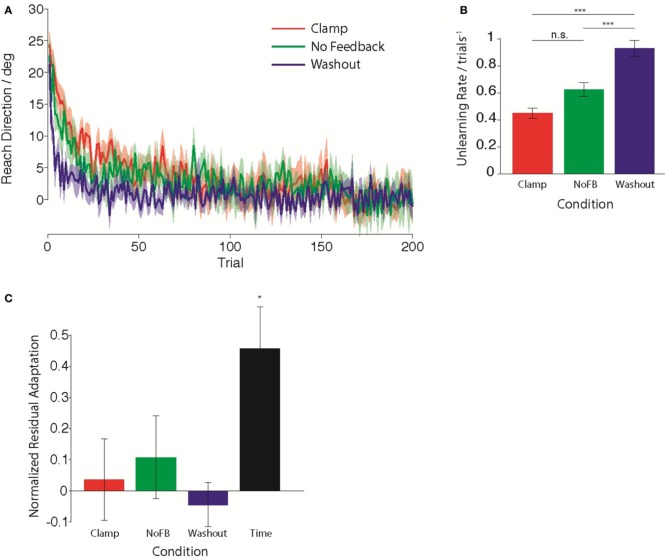
Figure 2.
Behavior during the Unlearning epoch. (A) Mean timecourse of unlearning in the Clamp (red), No Feedback (green), and Washout (blue) groups. Zero reflects baseline behavior. Shaded error bars indicate standard error in the mean across subjects. (B) Mean unlearning decay rate. (C) Normalized residual adaptation, assessed as the difference between directional error on the first trial of the Re-learning epoch and the extent of initial learning (last 20 trials of second epoch), divided by the amount of initial learning. Asterisk indicates significant difference from zero.

