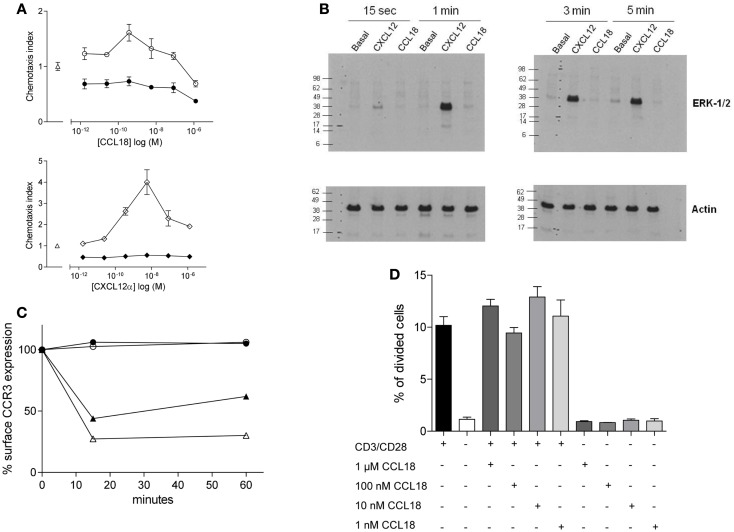
Figure 2.
Ability of CCL18 to induce signal transduction pathways and influence cell proliferation. One out of three independent experiments from separate donors is shown. (A) In vitro chemotactic responses of PBL mediated by CCL18 imply Giα-protein-coupled signal transduction mechanism. Chemotactic responses of PBL induced by CCL18 (○). Influence of PTX (200 ng/ml) on CCL18-mediated (●) chemotactic responses (upper panel). Chemotactic response mediated by CXCL12α (◊) and influence of PTX on CXCL12α-mediated responses (♦) (lower panel). Medium was used as a control (Δ). Data are expressed as chemotaxis index ± SEM. Data points are in triplicate. (B) ERK-1/2 phosphorylation analysis in T lymphocytes after stimulation with CCL18. Western Blot analysis using an anti-phosphor p44/42 MAPK (ERK-1/2) antibody. Time course for ERK-1/2 phosphorylation in T lymphocytes stimulated with 100 nM CCL18 or CXCL12α. Detection of actin was used as a loading control. (C) CCR3 cell surface expression after CCL18 stimulation of human eosinophils. Human eosinophils were stimulated with 12.5 nM CCL18 (○), CCL5 (▲), CCL11 (Δ), or 125 nM CCL18 (●) for 15 or 60 min. Ligand-induced CCR3 internalization was measured by Flow cytometry. Surface expression of CCR3 was compared with CCR3 expression of unstimulated eosinophils. Results are expressed in % of CCR3 surface expression. (D) T lymphocyte proliferation analysis after CCL18 stimulation. T lymphocytes were stimulated or not with anti-CD3/CD28 antibodies in the presence or absence of an increasing concentration of CCL18 (1 nM, 10 nM, 100 nM, or 1 μM). The division of cells was measured by CFSE and flow cytometry. Data points are in triplicate. Data are expressed in % of divided cells ± SEM.

