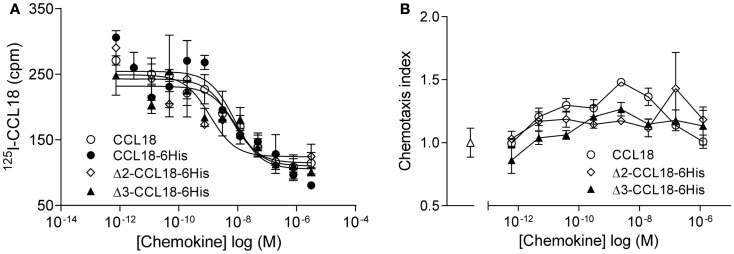
Figure 3.
Characterization of Δ2-CCL18 and Δ3-CCL18. (A) Equilibrium competition binding assay using 125I-CCL18 on PBL. Binding of 125I-CCL18 was competed using an increasing concentration of CCL18 (IC50: 6.44 nM), CCL18-6His (IC50: 7.89 nM), Δ2-CCL18-6His (IC50: 1.14 nM), Δ3-CCL18-6His (IC50: 9.04 nM) with equal potency. Data are expressed in cpm ± SEM. Data points are in triplicate. The graph represents a single experiment. (B) In vitro chemotactic response of PBL to CCL18 and the N-terminal truncated forms Δ2-CCL18-6His and Δ3-CCL18-6His. Medium (Δ) was used as a control. Data are expressed as chemotaxis index ± SEM. Data points are in triplicate. One representative experiment out of three is shown.

