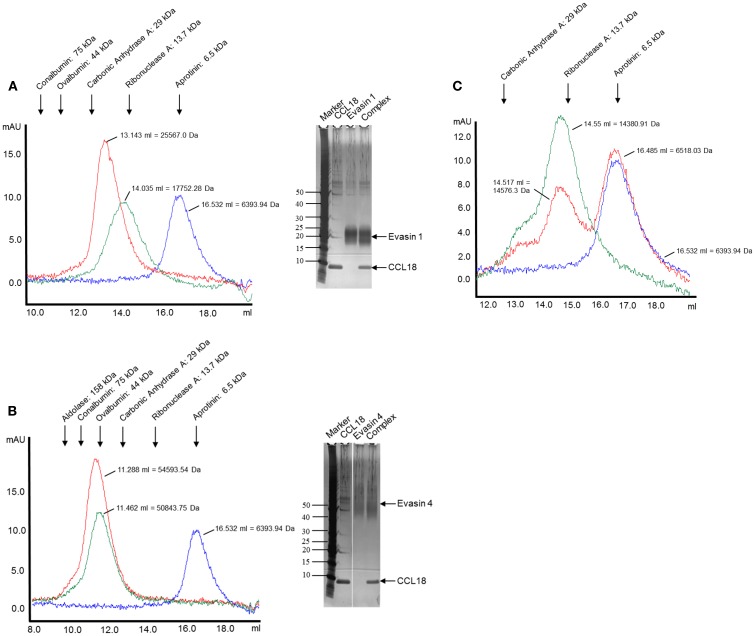
Figure 5.
Analysis of complex formation of Evasin-1, -3, and -4 with CCL18 by SEC. CCL18 was incubated with an equimolar amount of (A) Evasin-1, (B) -4, and (C) -3 and injected onto an analytical Superdex 75 Prepgrade 10/300GL Tricorn column. The elution profile of CCL18 (blue), Evasins (green), and the mixture of CCL18 and Evasins (red) is shown in milliabsorbance units (mAU). The elution volume and corresponding molecular weight are indicated for each peak. The elution volume of each protein used for calibration is indicated on the top according to their molecular weights. (A,B) SDS-PAGE analyses were performed with the fractions corresponding to the peak elution fractions. SDS-PAGE stained with silver. One representative experiment out of two is shown.

