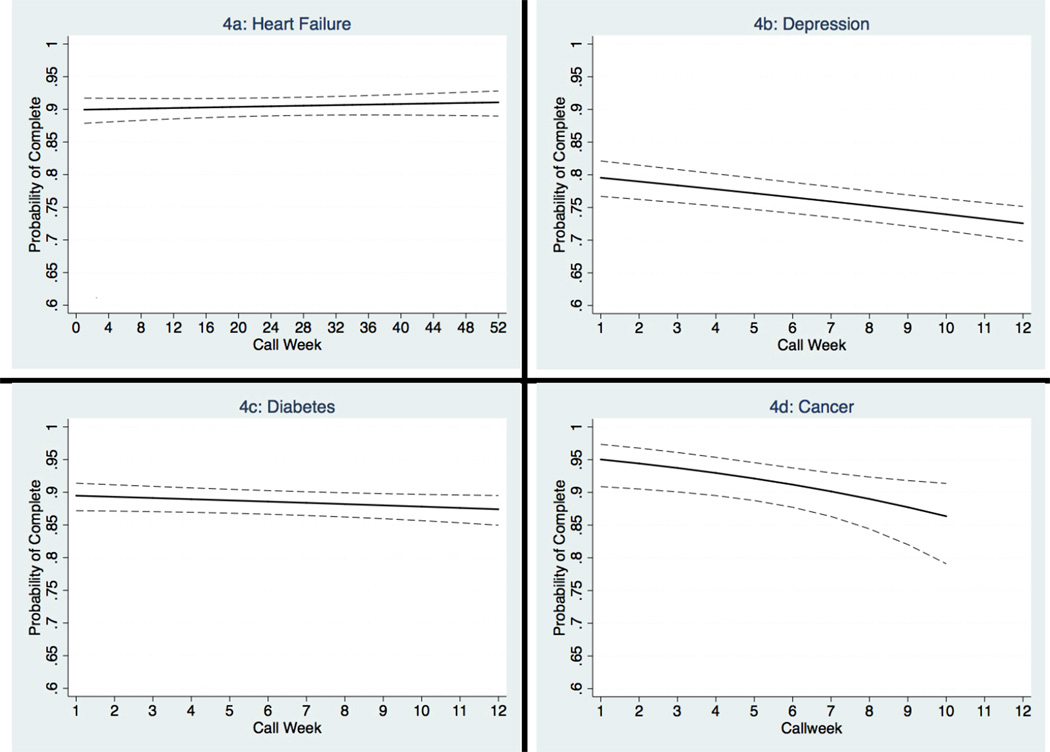
Figure 1. Probability of Call Completion Over Time by Program.
Dashed lines represent 95% confidence bands. Predicted probabilities were generated from multivariable logistic regression models using the predictors shown in the first column of Table 3.

