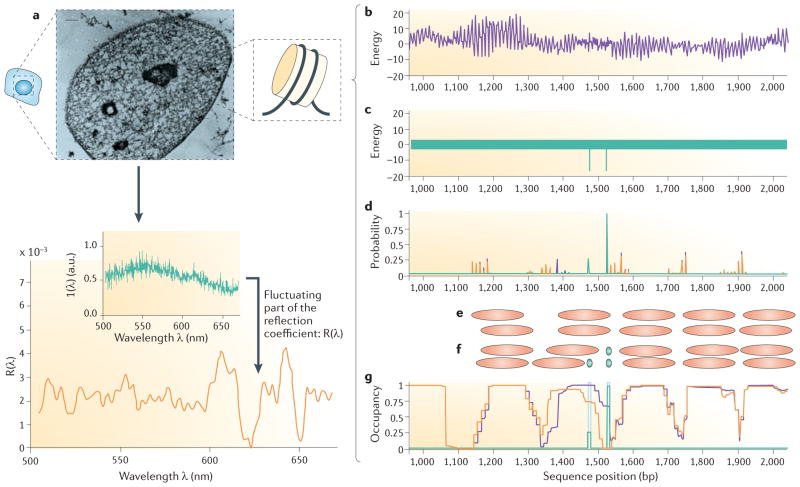
Figure 3. Physical sciences shed light onto nucleosome and transcription factor competition and chromosome packaging.
Schematic illustration of the partial wave spectroscopy (PWS) experiment (part a). Cells from the tissue of interest are brushed from the tissue and studied ex vivo. Each cell is individually scanned in a two-dimensional lattice of diffraction-limited pixels (strictly voxels because of the thickness of the cell). The cells are illuminated with light of wavelength λ, and backscattered waves propagating along one-dimensional paths within each voxel are measured as functions of lateral position over the cell (x, y) and of wavelength λ. Wavelength-dependent variability in reflectivity R at each pixel arises from the interference of photons scattered from refractive index fluctuations within the cell at that location, providing information about internal cellular heterogeneity on subwavelength length scales. The magnitude of the spectral fluctuations at each pixel in the image are represented by a disorder strength, Ld = <Δn2> × lc, where Δn is the local fluctuations in intracellular refractive index and lc is the correlation length of these fluctuations. For many different cancer types, the measured disorder strength increases in cells that that are located some distance away from a cancerous lesion, even though the cells being analysed are themselves not cancerous. Parts b–g illustrate the free energy landscape from a typical section of genomic DNA97. The 10 bp oscillations in interaction energy arise from the ~10 bp helical symmetry of DNA, the approximately circular DNA wrapping in the nucleosome, and the mechanical nature of the nucleosome–DNA interaction (part b). Parts c–g illustrate nucleosome–transcription factor competition97. The purple curves in part d show the corresponding distribution of nucleosome start probabilities with no transcription factor present (from the solution of equation 3 in BOX 2), and the top two rows of orange ovals (part e) represent two of the many different nucleosome configurations, all of which have significant probability in the equilibrium distribution. The purple curves in part g show the corresponding distribution of nucleosome occupancy (summed over the full set of allowed configurations, from the solution of equation 4 in BOX 2). The free energy landscape of a transcription factor, shown in part c, highlights two specific binding sites with equal energies (affinities), as indicated by the two sharp valleys in energy (the two green lines). The transcription factor also has slightly varying affinities for nonspecific sequences (indicated here by the thickness of the green bar covering the remainder of the landscape). In this example, the model is solved for a transcription factor concentration that is sufficiently high so as to give high occupancy at one of the binding sites (probability approaching 1; green curve in part d). However, because this site overlaps a preferred nucleosome location, binding at this site requires redistribution of the local nucleosome organization, to a new distribution of nucleosome start probabilities (orange curves in part d). The bottom two rows of orange and green ovals in part f represent two of the many different configurations of nucleosomes and bound factors, respectively, which have significant probability in the resulting equilibrium distribution. The corresponding nucleosome and transcription factor occupancies are shown in orange and green, respectively, in part g. Even though the two transcription factor sites have identical intrinsic affinities for the transcription factor, the required nucleosome redistribution is energetically inexpensive for the right-hand transcription factor binding site, compared with the left-hand transcription factor site, which allows a higher occupancy at the right-hand site for a given transcription factor concentration. The image of the nucleus in part a is reproduced, with permission, from REF. 146 (1997) National Academy of Sciences. The graph in part a is reproduced, with permission, from REF. 112. Parts b–g are reproduced, with permission, from REF. 97. a.u., arbitrary units.

