
Figure 12.
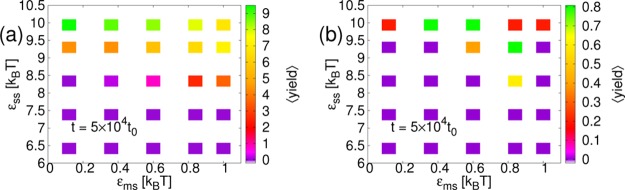
Results from SRD simulations. Plots of the average yield of complete structures, ⟨yield⟩, as a function of membrane-subunit interaction strength, εms and inter-subunit interaction strength, εss at time t = 5 × 10⁴t0 for membrane stiffness, λb = 2√3kBT and membrane viscosity, ηm = 133.3m/t0: (a) Subunits with interactions to form a cube. (b) Subunits with interactions to form a dodecahedron. Note the different scales for ⟨yield⟩ and also the higher values of εss as compared to the results for icosahedral cores.