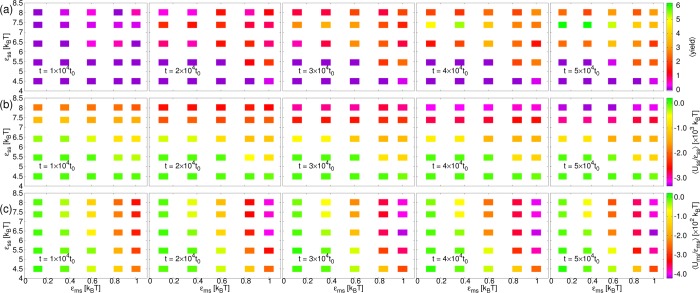
Figure 3.
Plots as a function of subunit-membrane interaction strength, εms, and inter-subunit interaction strength, εss at different times, t, increasing from left to right in intervals of 1 × 10⁴t0, for membrane stiffness, λb = 2√3kBT and membrane viscosity ηm = 133.3m/t0, from SRD simulations. (a) Average yield of complete cores, ⟨yield⟩. (b) Average total interaction energy between subunits, relative to the interaction strength, ⟨Uss/εss⟩. (c) Average total interaction energy between subunits and the membrane, relative to the interaction strength, ⟨Ums/εms⟩.

