
Figure 6.
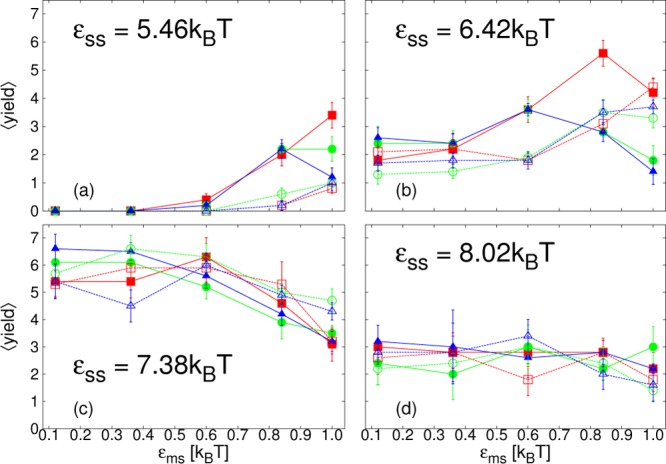
Plots of the average yield of complete cores, ⟨yield⟩, as a function of membrane-subunit interaction strength, εms, for membrane stiffness, λb = 2√3kBT at t = 5 × 10⁴t0. From simulations with SRD (solid lines, filled symbols) or LD (dashed lines, open symbols), for different membrane viscosities: ηm = 35.1m/t0 (blue, ▲/Δ); ηm = 133.3m/t0 (green, ●/○); ηm = 1190m/t0 (red, ■/□); and subunit interaction strengths, εss, as indicated in panels a–d.