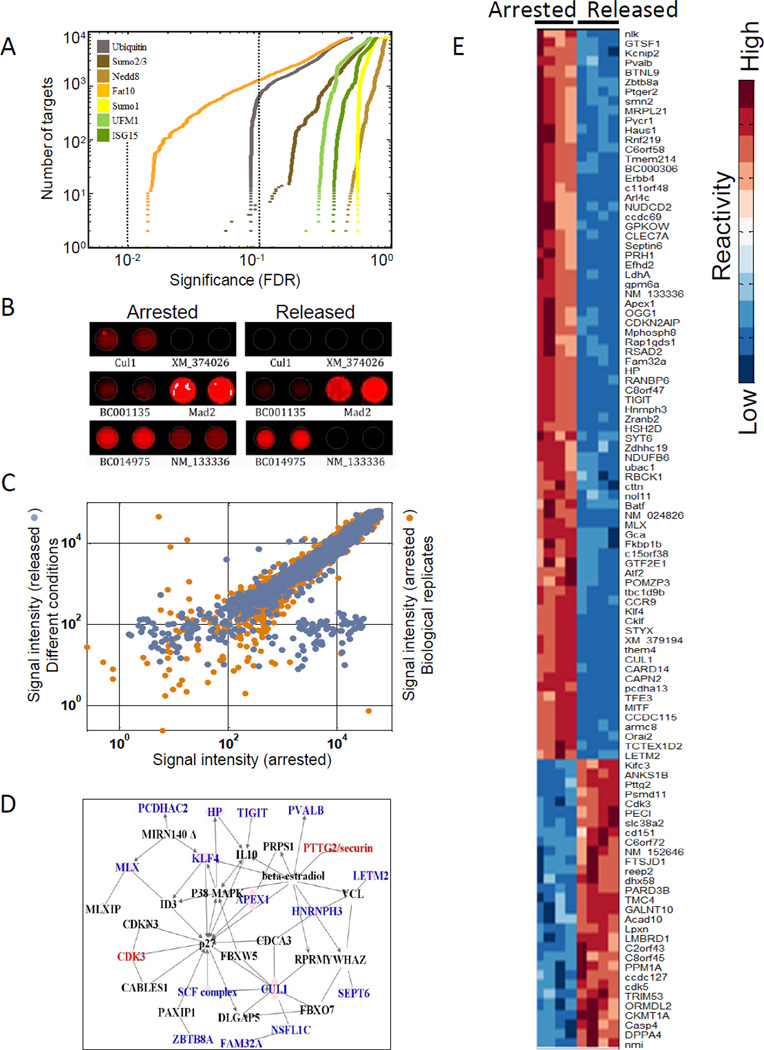
Figure 5. FAT10 targets are involved in cell cycle regulation and mitotic progression.
(A) Signal intensity of FAT10ylated protein targets were measured under nocodazole arrest and upon release from mitotic arrest. Values under the two conditions were compared using ANOVA and the resulting p-values were plotted (ascending order) for each Ubl separately. The two dotted lines indicate p-value cutoff levels of 0.1 and 0.05 (orange and brown, respectively). The y-axis denotes the cumulative number of target proteins that showed the stated significance in differential reactivity. (B) An example of duplicate spots of a FAT10 modified substrate under the two conditions, showing differences in reactivity. (C) Signal intensity of two biological replicates was compared to the signal intensity under the two different conditions for each protein. The x-axis: FAT10 signal intensity (log scale) under nocodazole arrest. Y-axis: replicate biological conditions (orange) or upon release from nocodazole arrest (blue). Dots that are off the diagonal represent the proteins that were differentially modified by FAT10 (D) Potential targets that mapped onto a known interaction network for cell cycle regulation. Color denotes increased (red) or decreased (blue) reactivity upon release from the mitotic arrest. Black names are interactors in the network that were not targeted by FAT10. (E) Proteins showing the highest differential modification under the two conditions (106) were clustered based on similarity. Signal intensity for each protein was standardized to have mean reactivity of 0 and standard deviation of 1. See related Figure S4.

