Figure 6.
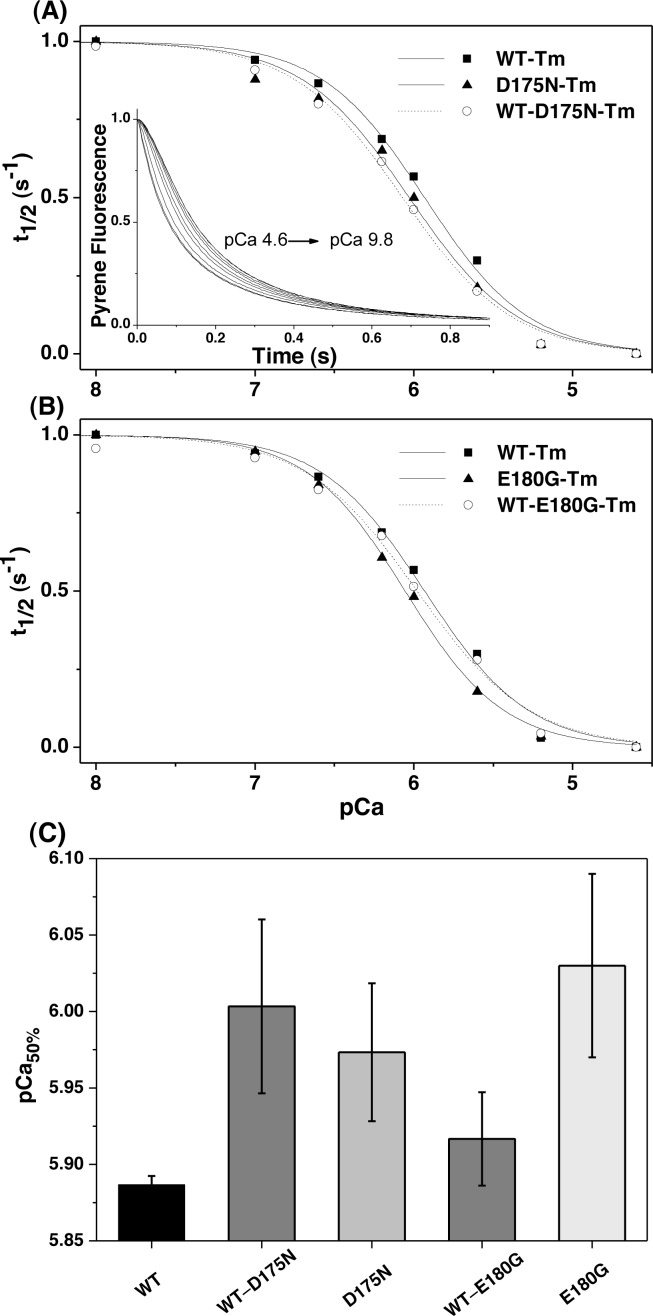
Dependence of the observed transient of S1 binding to the pyr-actin·Tm·cTn complex on calcium concentration. (A) Transients observed for the preincubated pyr-actin·αTm·cTn complex (0.25 μM ppA, 0.1 μM WT-D175N-Tm, and 0.1 μM hcTn) rapidly mixed with 2.5 μM S1 at various Ca2+ concentrations. The fractional half-time (t1/2) is plotted vs pCa concentration. Data for WT-Tm (■), WT-D175N-Tm (○), and D175N-Tm (▲) are shown in panel B and data for WT-Tm (■), WT-E180G-Tm (○), and E180G-Tm (▲)in panel C. The best fit to the Hill equation is superimposed with midpoints (pCa50%) and Hill coefficients (h) listed in Table 3. (D) Comparison of measured pCa midpoints for the five Tm constructs, including the standard deviation. Each column represents an average of three measurements. Experimental conditions: with addition of 2 mM pCa buffers at various Ca2+ concentrations.

