
Figure 2.
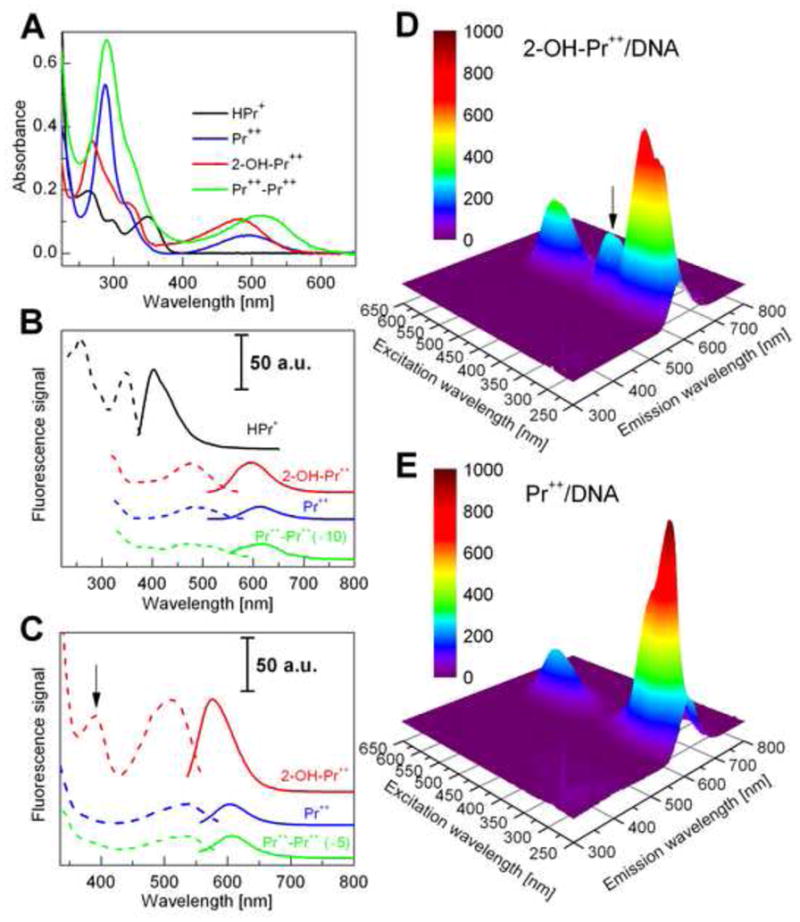
Spectroscopic properties of hydropropidine and its oxidation products. (A) The UV-Vis absorption spectra of HPr+ (10 μM) (black), Pr++ (10 μM) (blue), 2-OH-Pr++ (10 μM) (red) and Pr++-Pr++ (10 μM) (green) in phosphate buffer (50 mM, pH 7.4) containing 0.1 mM DTPA. (B) The florescence excitation (dashed line) and emission spectra (solid line) of HPr+ (1 μM), Pr++ (10 μM), 2-OH-Pr++ (10 μM) and Pr++-Pr++ (10 μM). (C) The fluorescence excitation (dashed line) and emission spectra (solid line) of Pr++ (1 μM), 2-OH-Pr++ (1 μM) and Pr++-Pr++ (10 μM) in the presence of DNA (0.1 mg/ml). (D) The FEEM spectrum of 2-OH-Pr++ (10 μM) in the presence of DNA (0.1 mg/ml). (E) The FEEM spectrum of Pr++ (10 μM) in the presence of DNA (0.1 mg/ml). The arrow marked in (C) and (D) indicates an additional excitation band for 2-OH-Pr++ (λmax = 391 nm).