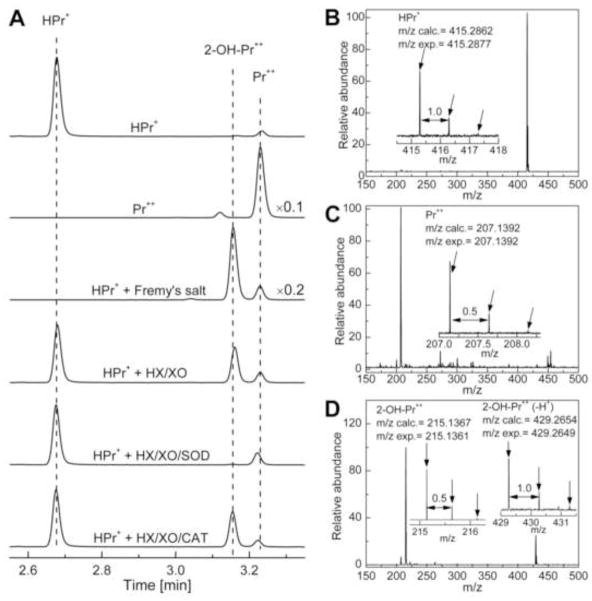
Figure 3.
HPLC and mass spectral analyses of products formed from O2·− and Fremy’s salt-mediated oxidation of HPr+. (A) HPLC traces of HPr+ (10 μM), Pr++ (10 μM), reaction mixtures containing Fremy’s salt and HPr+ or HPr+ and hypoxanthine/xanthine oxidase with and without SOD and catalase. Prior to HPLC analyses, HPr+ (10 μM), hypoxanthine (HX) (0.1 mM) and xanthine oxidase (XO) (10 mU/ml) were incubated in phosphate buffer (50 mM, pH 7.4) containing 0.1 mM DTPA for 30 min. Where indicated, incubations contained SOD (0.1 mg/ml) or catalase (0.1 kU/ml). The incubation mixture containing HPr+ (10 μM) and NDS (20 μM) was analyzed immediately after mixing the components. The HPLC traces were recorded at 290 nm. The HPLC traces were scaled by a factor 0.1 and 0.2, respectively, so as to fit the absorptions of Pr++ and HPr+/Fremy’s salt product on the same scale. (B) The mass spectrum of HPr+. (C) The mass spectrum of Pr++. (D) The mass spectrum of 2-OH-Pr++. Arrows in (B), (C) and (D) indicate isotopic peaks.

