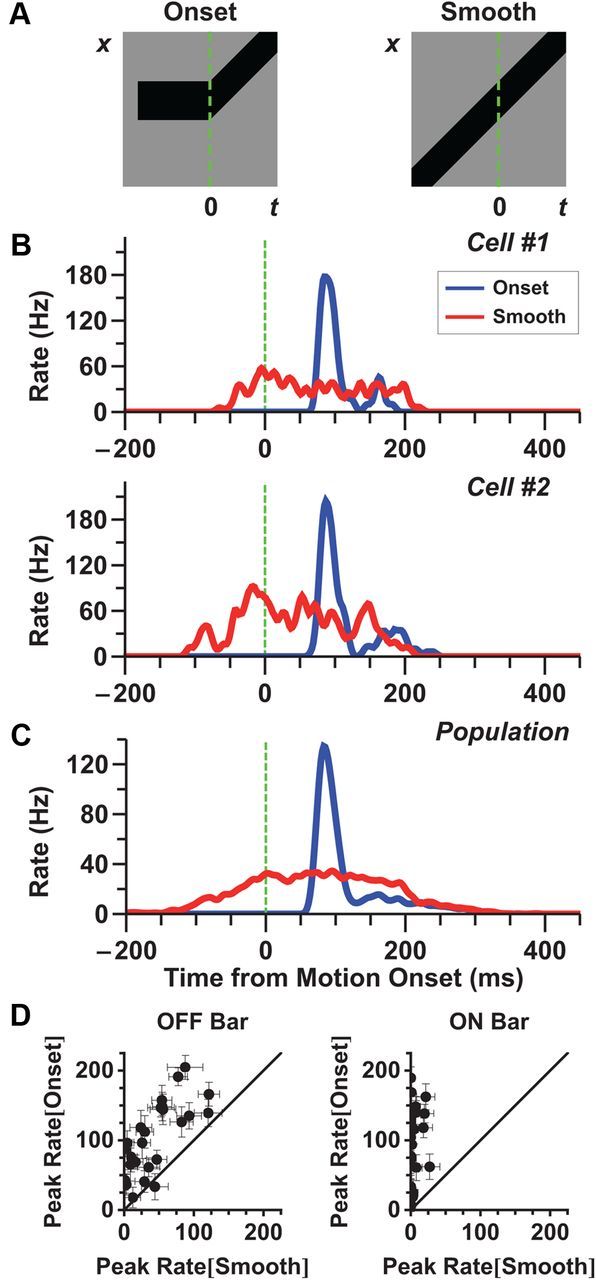
Figure 1.

The “alert response ” to motion onset is larger than the response to smooth motion. A, Stimulus diagrams for motion onset (left) and smooth motion (right); the green line shows the time of motion onset. Note that after motion onset, the two stimuli are identical. B, Firing rate of two individual fast OFF ganglion cells to motion onset (blue) and smooth motion (red). Starting locations of the bar were chosen so that the leading edge of the bar was as close to the receptive field center as possible. Note that the response to the initial appearance of the bar is not shown. It is shown in Figure 7B. C, Average firing rate of a population of 31 fast OFF cells. Motion onset responses for each cell were chosen from a starting location closest to its receptive field center coordinate and within 81 μm. D, Peak firing rate following motion onset versus firing rate during smooth motion at the same time (dots are individual fast OFF cells). Left, dark bars; right, bright bars. Error bars indicate 95% confidence intervals.
