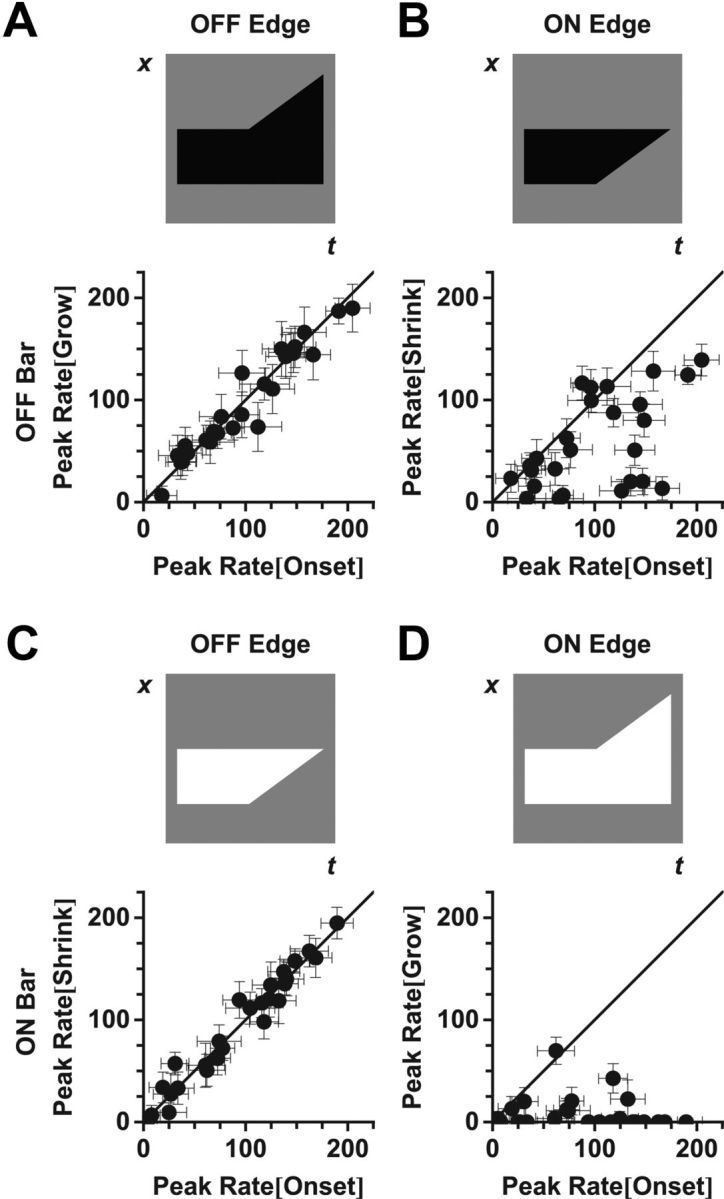
Figure 4.

The response to motion onset is strongly correlated with the motion of the OFF-polarity edge. Peak firing rate of 26 fast OFF cells for motion of the individual leading (grow) or trailing (shrink) edges versus the peak firing rate for full motion onset. Top, Stimulus schematics. Grow and shrink amplitudes were calculated at the same bar position as for motion onset. A, B, Dark bars. C, D, Bright bars. A, C, OFF-polarity edges. B, D, ON-polarity edges.
