
Figure 6.
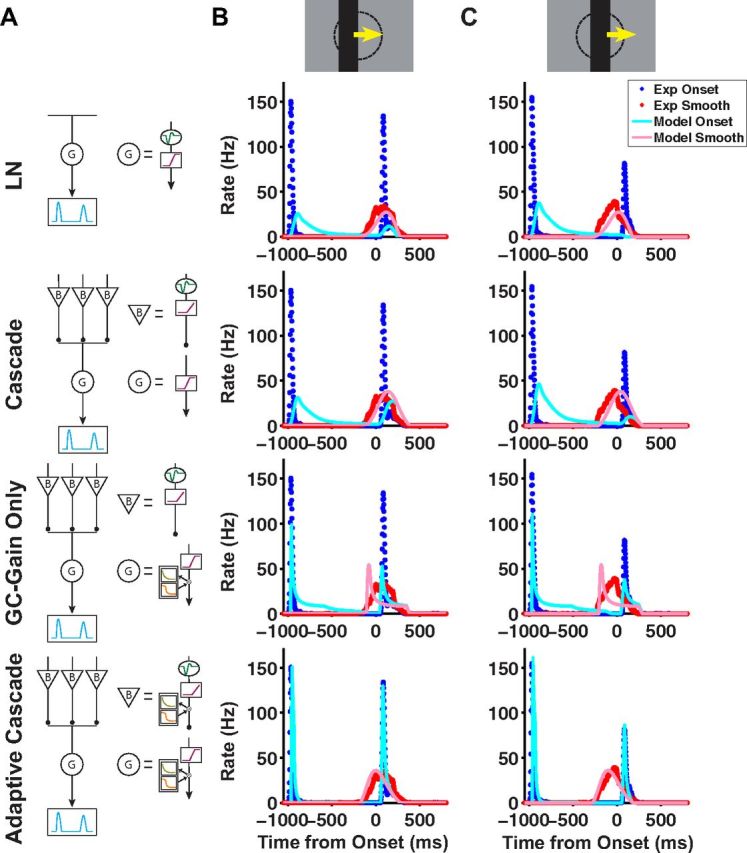
Different models fit to the motion onset response. A, Schematic diagrams of four different models: LN (first row), cascade (second row), cascade with gain control only at the ganglion cell level (third row), and adaptive cascade (fourth row). B, C, Model simulations of dark bars moving at a speed of 0.81 mm/s, where the bar's leading edge starts on center coordinate (B) and where the bar's center starts on center coordinate (C). Model firing rates versus time for motion onset (light blue) and smooth motion (pink) plotted together with the average firing rate for fast OFF ganglion cells for motion onset (blue) and smooth motion (red). In each row, the model used corresponds to the schematic in A.