
Figure 9.
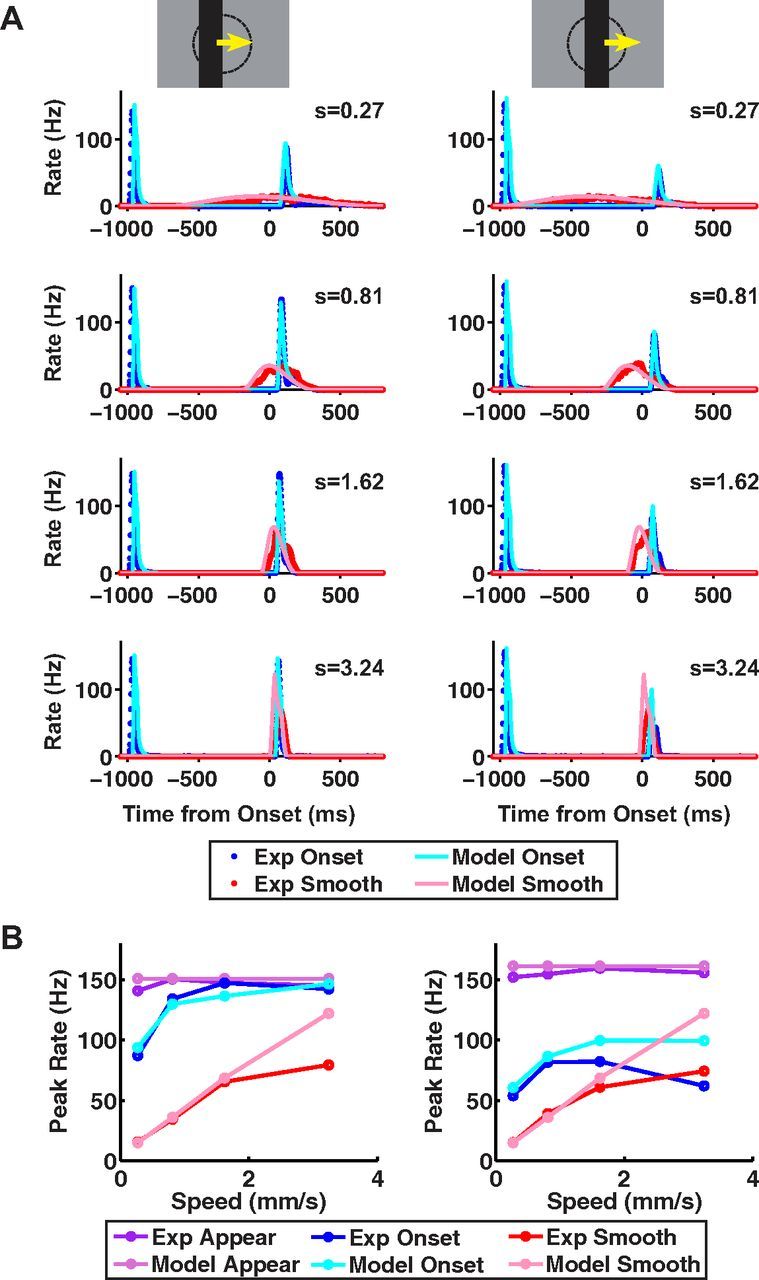
Data and ACM predictions for different stimulus speeds. ACM responses to 100% contrast bars moving at different speeds, where either the bar's leading edge starts on center coordinate (left) or the bar's center starts on center coordinate (right). All motion conditions are illustrated in Figure 1. A, Model firing rates versus time from motion onset for smooth motion (pink) and motion onset (light blue), plotted together with the average firing rate for fast OFF ganglion cells for smooth motion (red) and motion onset (blue). B, Peak firing rate versus contrast for responses to bar appearance, motion onset, and smooth motion; purple, blue, and red lines: experimental data; light purple, light blue, and pink lines, ACM.