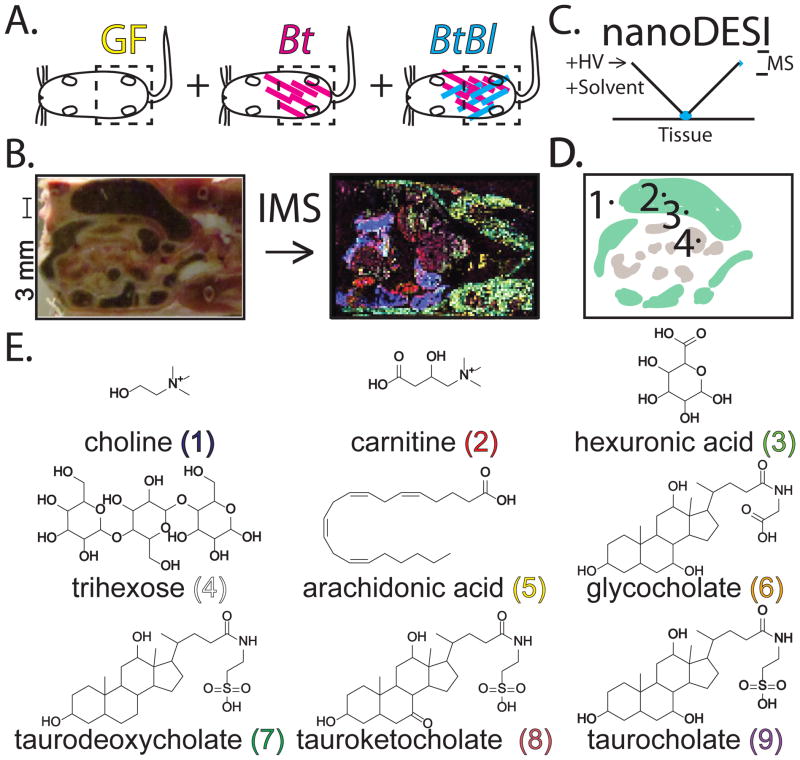
Figure 1.
Experimental design. (A) GF: Germ-free, Bt: mono-associated Bacteroides thetaiotaomicron, and BtBl: bi-associated associated Bacteroides thetaiotaomicron plus Bifidobacterium longum mice. Color-coding is noted and conserved in Figures 2–3. (B) Gut tissue sections were imaged via mass spectrometry to reveal metabolite distributions in false color. A scale bar is noted for all images. (C) NanoDESI FT-MS was applied for in situ compound identification. The capillaries are drawn to scale with the tissue section, however the actual droplet contact area is substantially smaller. HV: high voltage, MS: mass spectrometer. (D) Regions of interest from a mouse gut tissue section: 1. host connective tissue, 2. large intestine lumen, 3. large intestine/epithelial border, and 4. small intestine. (E) Selective compounds (1–9) identified by IMS and nanoDESI FT-MS. Stereochemistry is not illustrated as MS-based methods cannot readily distinguish contributions from different isomers. The exact contributions from specific regioisomers (C3, C7, C12) for (7–8) are not known—only the C7 modified isomer is illustrated. Compounds are with conserved color-coding as Figure 3. Observed m/z values are provided in Figure 3.

