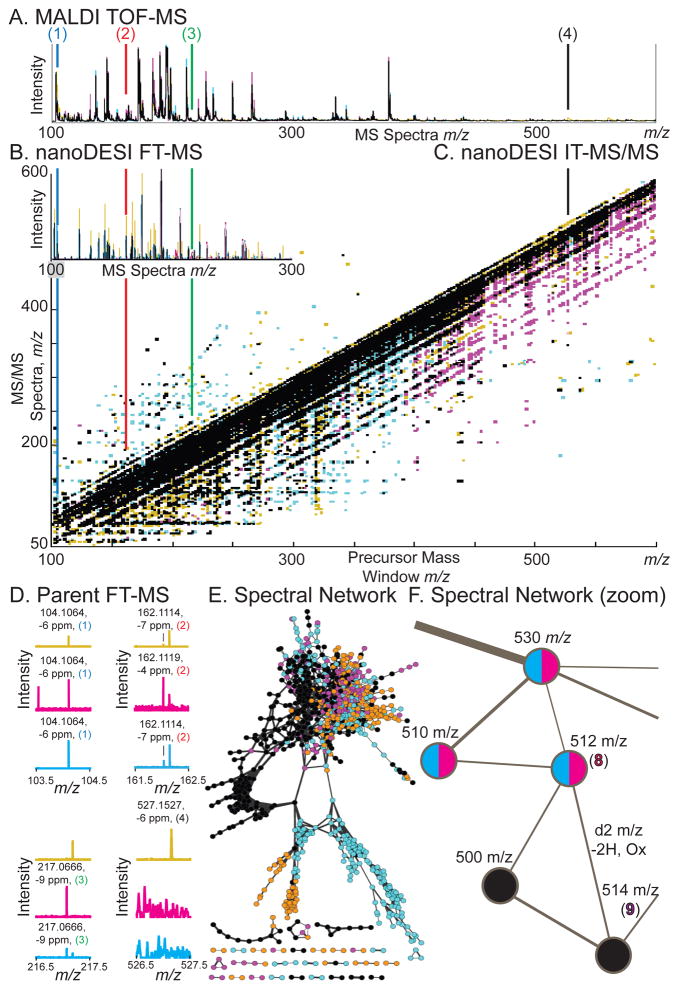
Figure 2.
Identification of metabolites detected from IMS experiments. Germ-free, mono-associated Bacteroides thetaiotaomicron, and BtBl: bi-associated associated Bacteroides thetaiotaomicron plus Bifidobacterium longum mice are noted by color, with overlap in black. Compounds (1–4, 8–9) are displayed with conserved color coding as in Figures 1, 3. (A) MALDI-TOF MS average spectra displayed as intensity versus m/z. (B) NanoDESI-FTICR MS displayed as intensity versus m/z. (C) Data-independent iontrap (IT)-MS/MS data from the large intestine/epithelial border (Figure 1D–3.) displayed as intensity in Z, MS/MS spectra in m/z in Y, versus precursor mass window in X in m/z. (D) Zoomed nanoDESI FT-MS spectra from (B) for (1–4) displayed as intensity versus MS spectra in m/z. Accurate mass assignments are noted, correlating with IMS data. See Figure S1 for zoomed nanoDESI-MS/MS spectra from (C). (E) Spectral network clustering of data-independent MS/MS data. Nodes are linked based on MS/MS spectral similarity as a proxy for chemical similarity. This figure is an alternative view of (C), illustrating some of the complexity of the dataset. (F) Spectral network zoomed, illustrating a node at m/z −512 (8) connected to a node at m/z −514 (9). This data illustrates how spectral networking can be used to link known compounds to unknowns—forming visual data hypotheses for manual validation.

