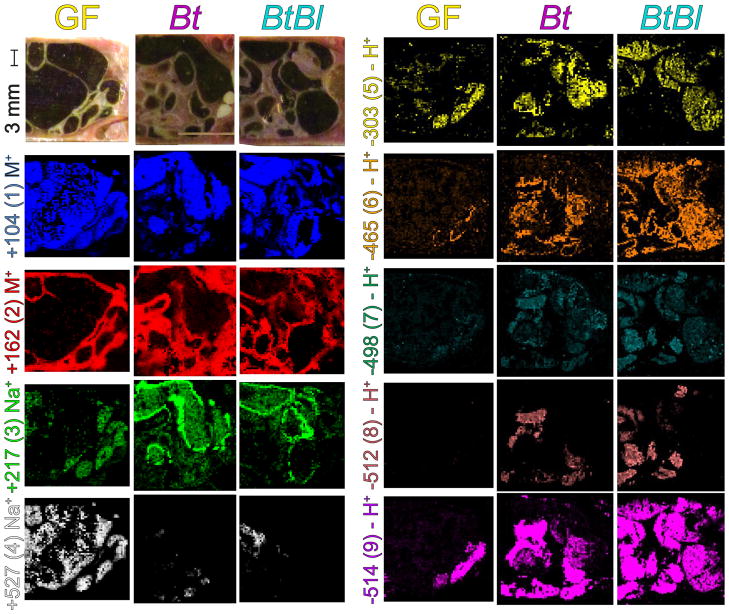
Figure 3.
Imaging mass spectrometry of the gut of three mouse microbiota models. A series of panels are provided for GF, Bt, and BtBl associated mice. The panels represent the ventral view of the mouse with the anterior facing left and the posterior facing right (Figure 1A). Selected anatomical features are noted (Figure 1D).Orientation and color of IMS data match (Figure 1E). Optical images were taken at the block face with a universal scale provided. Each false-colored IMS image represents the normalized signal intensity for the m/z value illustrated corresponding to (1–9) as a particular ion or charged adduct. Identities of m/z values were assigned by nanoDESI MS/MS and LC-MS (Figures 2 and S1–4). This figure thus depicts differential signal and localization patterns of (1–9) across three sample conditions.

