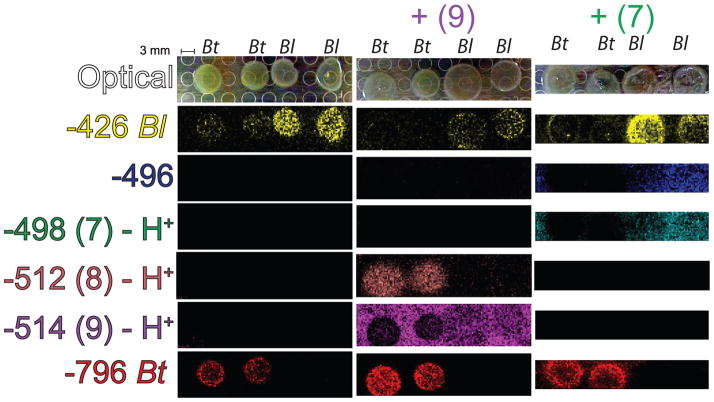
Figure 4.
Imaging mass spectrometry to explore microbial bile acid transformations. A series of panels are provided for two colonies of Bt and two colonies of Bl on TYG agar, TYG agar + taurocholate (9), and TYG agar + deoxytaurocholate (7). The panels represent the portion of the Petri dish agar relocated to a MALDI target plate. Each false-colored image represents the normalized signal intensity for the m/z value illustrated. Identities of m/z values were assigned by nanoDESI MS/MS and LC-MS (Figures 2 and S1–4). For compounds (7–9) present in Figures 1–3, identical color coding is utilized.

