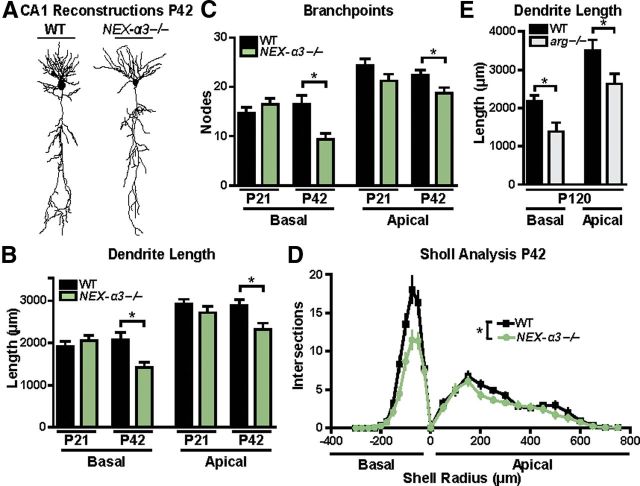
Figure 2.
Hippocampal dendritic arbors develop normally in NEX–α3−/− mice but are reduced by P42. A, Representative Neurolucida dendrite reconstructions of WT and NEX–α3−/− hippocampal CA1 pyramidal neurons at P42. B, C, Mean total dendrite length (B) and branch-point number (C) of basal (left) and apical (right) dendrites of hippocampal CA1 pyramidal neurons. Dendrite length and branch points of both basal and apical arbors in NEX–α3−/− neurons are reduced at P42 compared with WT littermates. There are no differences between WT and NEX–α3−/− neurons at P21 in any of the measured morphological parameters. ANOVA between groups: basal length, F = 5.018, p = 0.0028; apical length, F = 4.034, p = 0.0098; basal branch points, F = 6.101, p = 0.0008; apical branch points, F = 3.827, p = 0.0128. Post hoc Student's t test: basal length, p = 0.4317 for P21, p = 0.0057 for P42; apical length, p = 0.2804 for P21, p = 0.0104 for P42; basal branch points, p = 0.3186 for P21, p = 0.0019 for P42; apical branch points, p = 0.1144 for P21, p = 0.0232 for P42. n = 19–31 neurons from 11–15 mice for each group. D, Sholl analysis of WT and NEX–α3−/− neurons at P42 to measure dendrite complexity from the same neurons reconstructed above demonstrates a reduction in NEX–α3−/− neurons throughout the entire dendrite arbor. Two-way ANOVA (shell radius × genotype): interaction, F = 4.589, p < 0.0001; effect of genotype, F = 43.63, p < 0.0001; effect of shell radius, F = 43.63, p < 0.0001. E, Mean total dendrite length of basal (left) and apical (right) hippocampal CA1 pyramidal neurons is reduced in arg−/− mice at 4 months compared with WT. ANOVA between groups: F = 12.87, p < 0.0001. Post hoc Student's t test: basal length, p = 0.017; apical length, p = 0.0377. Error bars indicate mean ± SEM. *p < 0.05.

