Figure 5.
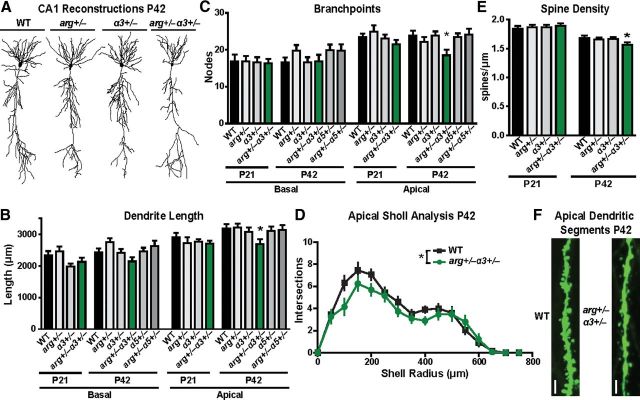
Integrin α3 and Arg kinase functionally interact to regulate the maintenance of hippocampal apical dendrite length and spines. A, Representative Neurolucida dendrite reconstructions of WT, arg+/−, α3+/−, and arg+/−α3+/− hippocampal CA1 pyramidal neurons at P42. B, C, Mean total dendrite length (B) and branch-point number (C) of basal (left) and apical (right) dendrites on hippocampal CA1 pyramidal neurons. Apical dendrite length and branch points of arg+/−α3+/− mice are reduced at P42 compared with WT littermates. ANOVA between groups at P21: basal length, F = 2.482, p = 0.0664; apical length, F = 1.820, p = 0.1305; basal branch points, F = 0.0364, p = 0.9906; apical branch points, F = 1.196, p = 0.3164. ANOVA between groups at P42: basal length, F = 2.409, p = 0.0531; apical length, F = 2.985, p = 0.0354; basal branch points, F = 1.209, p = 0.3106; apical branch points, F = 3.088, p = 0.0314. Post hoc Student's t test apical length: WT, p = 0.0193; arg+/−, p = 0.0105; α3+/−, p = 0.0403. Post hoc Student's t test apical branch points: WT, p = 0.0149; arg+/−, p = 0.0410; α3+/−, p = 0.0077. n = 27–31 neurons from 14–19 mice for each group. D, Sholl analysis of WT and arg+/−α3+/− neurons at P42 to measure dendrite complexity from the same reconstructions demonstrates a reduction in arg+/−α3+/− neurons throughout apical dendrite arbor only. Two-way ANOVA (apical shell radius × genotype): interaction, F = 1.574, p = 0.049; effect of genotype, F = 5.47, p = 0.023; effect of shell radius, F = 48.54, p < 0.0001. E, Mean dendritic spine density is reduced in arg+/−α3+/− mice at P42 compared with WT littermates. ANOVA between groups: F = 2.697, p = 0.047. Post hoc Student's t test: p = 0.0336. n = 38–50 neurons from 5 mice per group. F, Representative reconstructions from confocal z-stacks of apical dendrite segments from P42 GFP-expressing WT and arg+/−α3+/− hippocampal CA1 neurons. Scale bar, 10 μm. Error bars indicate mean ± SEM. *p < 0.05.

