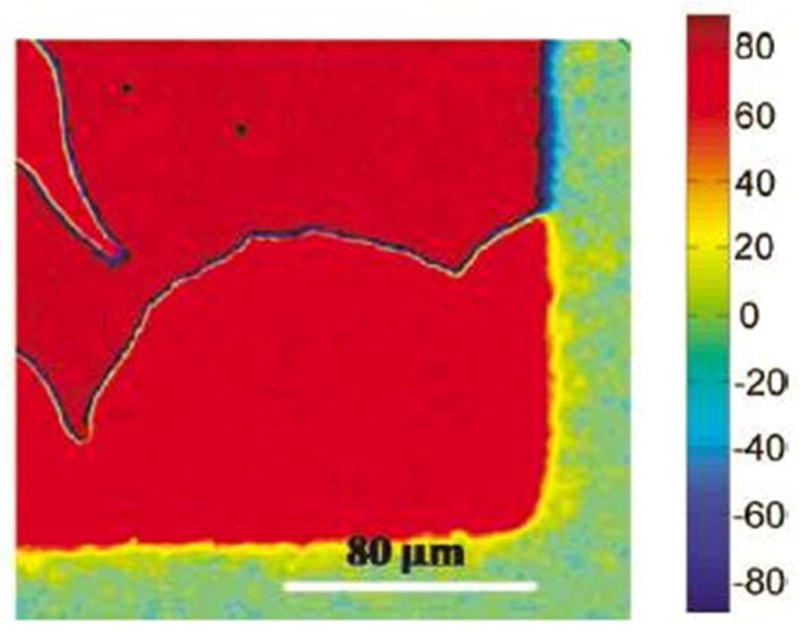
Figure 11.

Optical map depicting spatial variation of the twist angle within a LC that is anchored on a chemically patterned surface. The color chart shown at the right side of the figure indicates the twist angle. Measurement of the position-dependent twist angle of the LC can be used to image chemical patterns on surfaces (see text for details). Reproduced with permission.23
