
Figure 7.
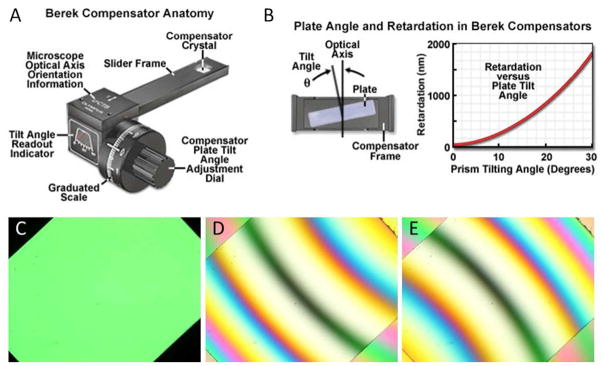
Measurement of optical retardance using a Berek compensator. (A) Schematic illustration of a Berek compensator. (B) Illustration of the calcite crystal within a Berek compensator, and the tilting of the crystal to introduce compensating retardance into the optical path. (C) Polarized white light micrograph of a birefringent LC sample viewed between crossed polarizers when rotated by 45° from extinction. (D, E) Optical images following insertion of a Berek compensator into the optical path and subsequent rotation of the compensator dial, both forward (D) and backward (E), to locate a black fringe in the middle of the image. (A) and (B) reproduced with permission.52