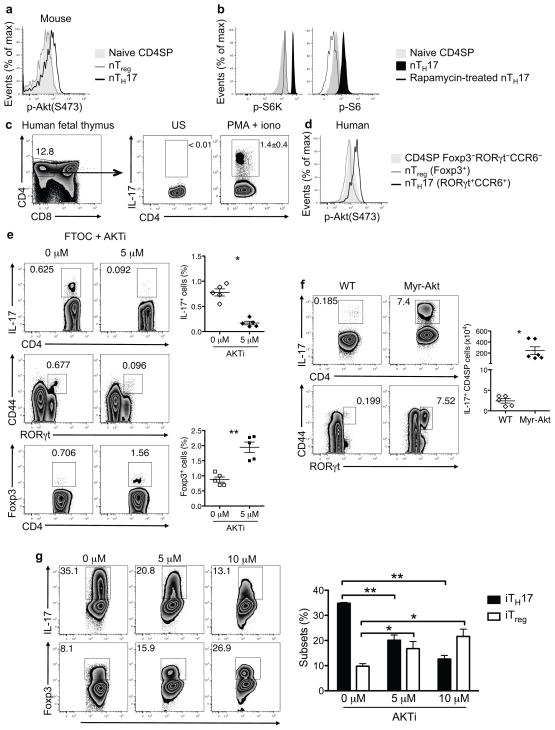
Figure 1.
Akt regulates development of both nTH17 and iTH17 cells. (a) Akt phosphorylation (p- Akt) at the S473 site was determined for the indicated wild-type (WT) thymocyte populations by phospho-flow staining. Naive CD4SP (CD4SP CD44lo CCR6−), nTreg (CD4SP Foxp3+) and nTH17 cells (CD4SP CD44hi CCR6+) were analyzed. (b) S6K phosphorylation (p-S6K) and S6 phosphorylation (p-S6) was assessed in the indicated thymocyte populations from WT mice by flow cytometry. The specificity of the phospho-flow staining was verified by treatment of thymocytes with rapamycin for 1 h at 37 °C prior to staining. (c) IL-17 is expressed in thymocytes from human fetal thymi upon ex vivo stimulation for 5 h with PMA/ionomycin and brefeldin A. Flow plots are gated on live lymphocytes (left) and CD4SP cells (middle and right). (d) Phospho-flow analysis of p-Akt at the S473 site is shown for the indicated thymocyte populations from human fetal thymi. (e) Expression of IL-17A, ROR-γt, CCR6, and Foxp3 is shown for thymocytes from day 7 of E15-initiated FTOC, cultured for the last 2 days in the presence of indicated concentrations of allosteric Akt inhibitor, AKTi. Cultures were stimulated with PMA/ionomycin prior to staining. Representative flow plots are gated on CD4SPTCRβ+TCRγδ− cells. Graphs show either the percent of IL-17A+ or Foxp3+ cells among CD4SP cells pooled from three independent experiments (n = 5 thymi per condition; mean ± SEM; *P<0.0001, **P=0.0124; P value from two-tailed Student’s t- test). (f) IL-17 production in thymocytes from WT and Myr-Akt mice following ex vivo stimulation was determined. Representative flow plots show staining on CD4SPTCRβ+TCRγδ− gated cells. Graphs are of pooled data from two independent experiments (n ≥ 5; mean ± SEM; *P=0.013, P value from two-tailed Student’s t-test). (g) WT naïve (CD44lo CD62Lhi CD25−) CD4+ T cells were activated for 18 h with anti- CD3 plus anti-CD28, followed by 36 h of culture in iTH17-polarizing conditions in the presence of indicated concentrations of AKTi. IL-17 or Foxp3 expression was determined following restimulation with PMA/ionomycin. Representative flow plots are shown. The graph is of pooled data from n = 3 per condition (bars and error bars represent mean ±SEM. *P ≤ 0.05, ** P≤ 0.001 (one-way ANOVA followed by Dunnett’s post-test with 0μM as control group). Data are representative of at least three independent experiments (a–d,g).

